Ionosphere Status
Monitoring of ionospheric ionization and Total Electron Content.
Introduction
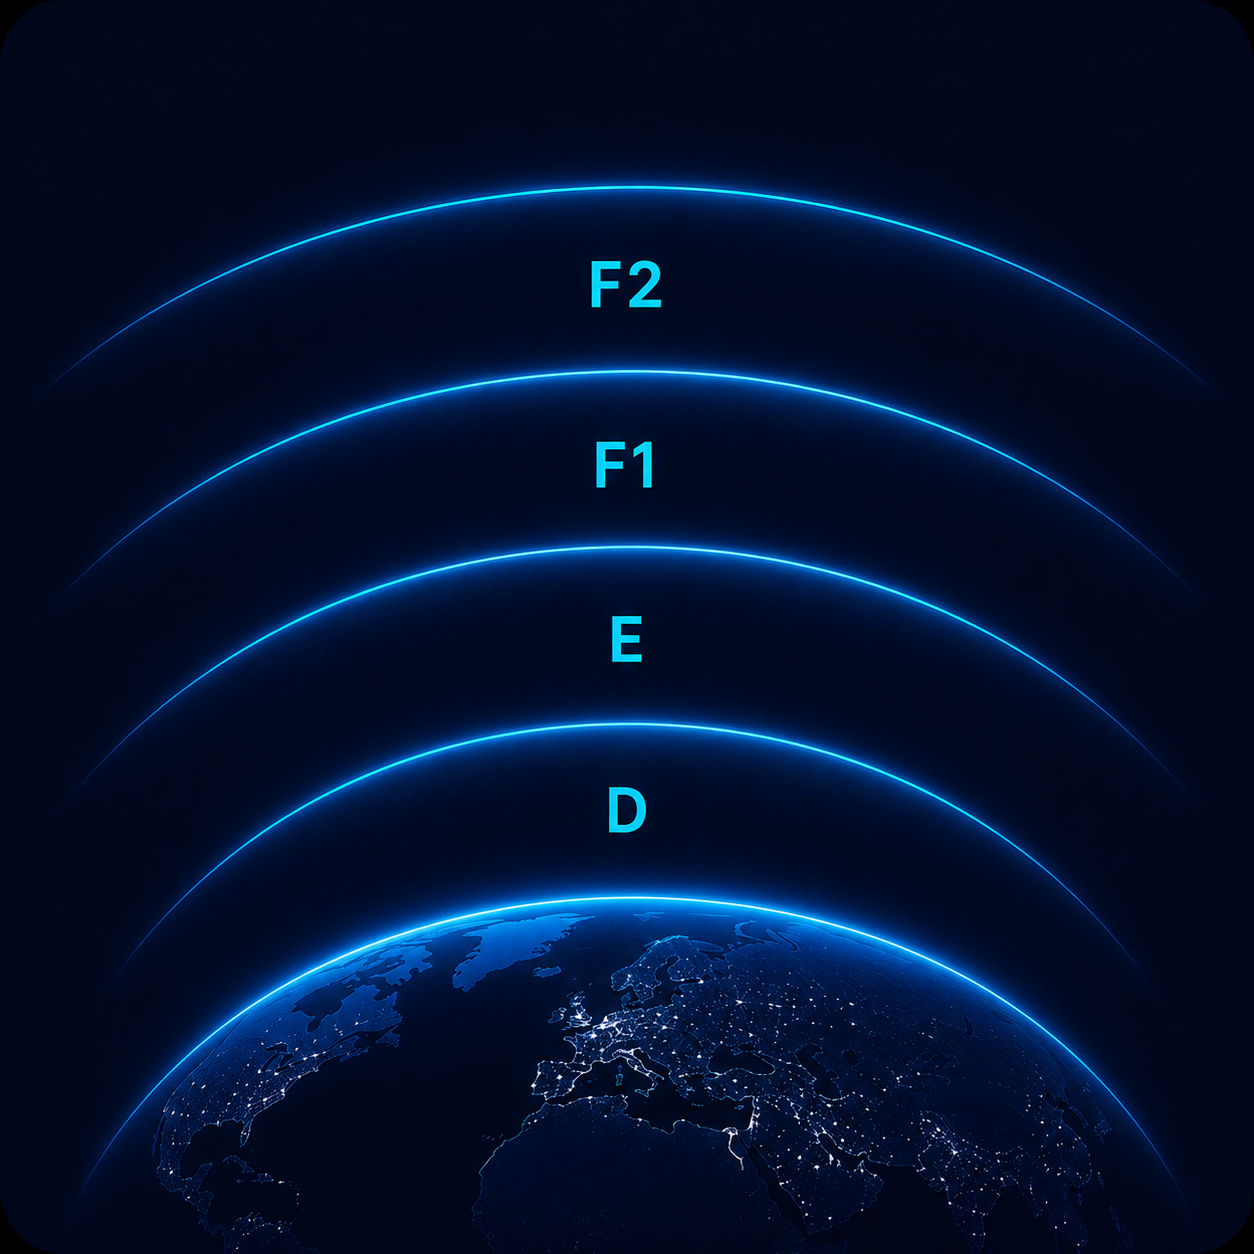
The ionosphere is a dynamic region of Earth's upper atmosphere, located at an altitude between 50-965 km (30-600 mi), whose ionization varies continuously in response to solar radiation, geomagnetic activity, energetic-particle precipitation, and other atmospheric processes. As a result, its state is closely related to space weather conditions.
The ionization process in the ionosphere occurs when high-energy solar radiation, primarily extreme ultraviolet (EUV) and X-ray photons, strikes neutral atoms and removes one or more electrons from them. This creates a plasma of free electrons and positively charged ions.
Depending on the region of the ionosphere in which ionization occurs, different effects will be produced: in the E and F Regions, the refraction of HF radio waves is enhanced, whereas in the D Region, their absorption is enhanced.
Variations in electron density and in the structure of the ionosphere can therefore significantly affect HF radio-wave propagation, altering usable frequencies and propagation paths and, under disturbed conditions, causing signal degradation or loss of communications.
The Total Electron Content (TEC) represents the total number of free electrons integrated along a path through the ionosphere. It provides a useful measure of the overall ionospheric electron content and its spatial and temporal variations.
TEC is expressed in Total Electron Content Units (TECU), where 1 TECU = 1016 electrons per square meter. TEC varies with factors such as solar radiation, local time, latitude, season, solar activity, and geomagnetic conditions, reflecting changes in the production, loss, and redistribution of ionospheric plasma.
The TEC maps are color-coded according to TECU values. Higher TEC values indicate a greater total electron content along the vertical ionospheric column. During normal conditions, TEC generally increases in sunlit regions as solar extreme-ultraviolet radiation enhances ionization, although its geographical distribution is also strongly influenced by ionospheric dynamics and geomagnetic conditions. TEC and the F2-layer critical frequency (foF2) are often positively correlated, but they represent different properties of the ionosphere: TEC measures the integrated electron content, whereas foF2 is determined by the peak electron density of the F2 layer. TEC maps can therefore provide a useful general indication of ionospheric conditions, but they should not be interpreted as direct maps of foF2.
Total Electron Content (TEC Maps)
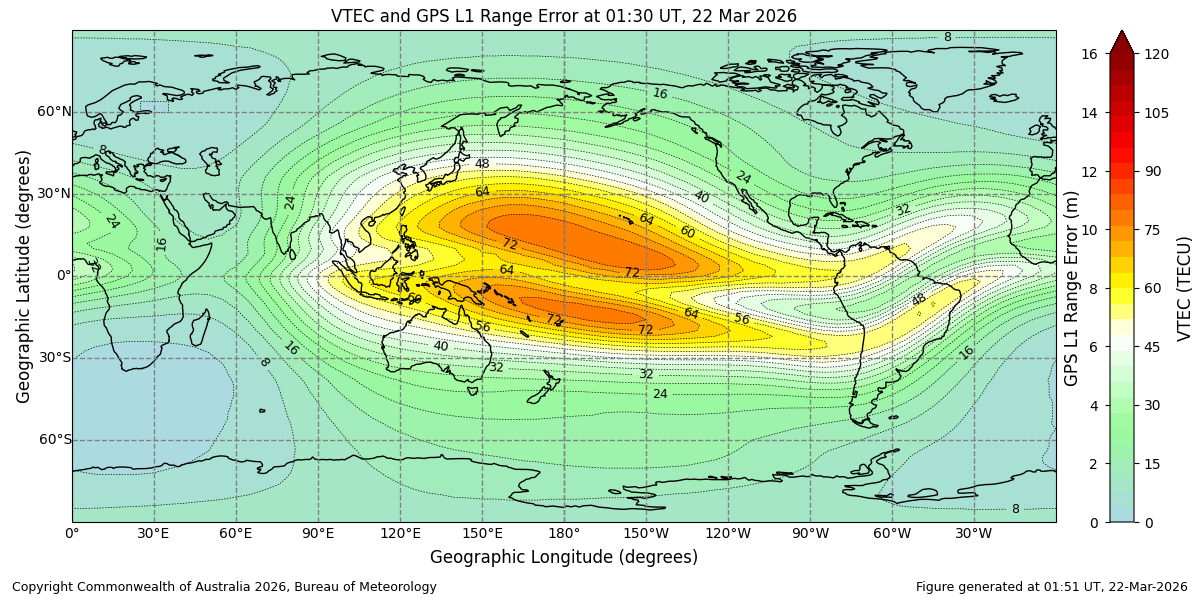
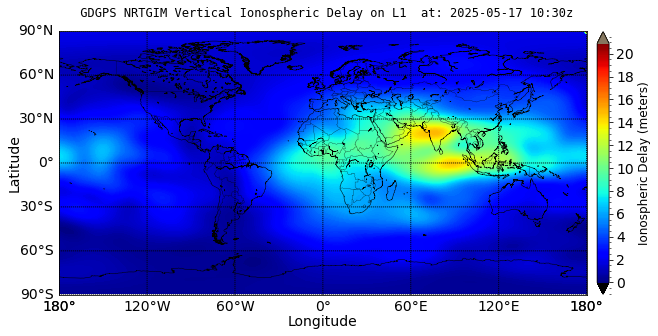


As a general guide for HF radio operators, regions of relatively high TEC often indicate stronger ionization and may be associated with higher usable frequencies, whereas regions of relatively low TEC may be associated with reduced usable frequencies. The most useful information is often obtained by observing changes in TEC over time and differences from expected or normal values, rather than interpreting the absolute TEC value alone. Rapid increases, decreases, or strong spatial gradients may indicate disturbed ionospheric conditions and potentially unstable or unexpected HF propagation.
TEC maps should therefore be used as a general indicator of ionospheric conditions, rather than as a direct prediction of the Maximum Usable Frequency (MUF). For selecting operating frequencies, ionosonde observations and derived parameters such as foF2, together with path-specific MUF estimates or predictions, provide more direct information. Check the Radio Communications section for further information.
TEC maps can be produced from Global Navigation Satellite System (GNSS) observations, ionospheric models, or a combination of observations and models. GNSS-based maps use measurements of the ionospheric effects on signals transmitted by satellites such as GPS to estimate Total Electron Content and generate regional or global maps of its distribution.
HF Radio & Space Weather is a resource dedicated to the operational monitoring of space weather and HF propagation conditions.
This is an educational, non-commercial website. All displayed data is property of their authors and credit and hyperlinks to the corresponding sources are provided. If you want to contact the webmaster, please use this form.