Introduction

Several space-weather phenomena can affect radio communications and radionavigation systems across a wide range of frequencies, from very low frequency (VLF) bands to those used by satellite-based services. Solar flares can rapidly increase ionization in the lower ionosphere, particularly in the D-region on the sunlit side of Earth, causing enhanced absorption of HF radio waves and potentially producing radio blackouts. Solar Radiation Storms induced by Solar proton events (SPEs) can also increase D-region ionization, particularly at high geomagnetic latitudes, where they may cause severe HF absorption known as Polar Cap Absorption (PCA).

Geomagnetic storms, on the other hand, can significantly alter the structure and electron density of the ionosphere, causing variations in the Maximum Usable Frequency (MUF) between radio stations. A reduction in MUF can degrade or close propagation paths at higher HF frequencies, while under some disturbed conditions increases in ionospheric electron density may raise the MUF and temporarily enhance propagation or produce openings at higher frequencies.

Finally, the Sun also produces bursts of radio emission across the radio spectrum. These emissions are classified into different types and can generate interference, degrading the signal-to-noise ratio of radio communication systems.

This page provides a detailed description of the space weather phenomena that affect radio communications. You may also wish to consult the Current Space Weather section, where you will find an HF Radio Dashboard containing the most relevant operational information.
NOAA Radio Alerts

Alerts

Source: NOAA
HF Radio Blackout

HF Radio Blackout

Geomagnetic Storm

Geomagnetic Storm

Solar Radiation Storm

Solar Radiation Storm

Interpretation

The United States National Oceanic and Atmospheric Administration (NOAA) has defined three scales to quantify the effects of space weather events on technological systems and human activities. These three scales can also be used to assess the impact of such events on HF radio communications.

  • The "R" scale describes the severity of HF radio blackouts caused by enhanced X-ray emissions from solar flares and ranges from R1 (Minor) to R5 (Extreme). The effects occur primarily on the sunlit side of Earth, where increased D-region ionization enhances HF absorption. Check the Solar Activity page for further information.
  • The "G" scale describes the intensity of geomagnetic storms and ranges from G1 (Minor) to G5 (Extreme). Geomagnetic storms can disturb the ionosphere, producing increases or decreases in foF2 and MUF and consequently affecting HF propagation. Check the Geomagnetic Storms page for further information.
  • The "S" scale describes the intensity of solar radiation storms and ranges from S1 (Minor) to S5 (Extreme). Energetic solar protons can increase D-region ionization at high geomagnetic latitudes, producing Polar Cap Absorption (PCA) and potentially severe degradation of HF communications over polar paths. Check the Solar Radiation Storms page for further information.

For a comprehensive description of the R, S, and G scales and their associated effects, please consult the NOAA Space Weather Scales.

BOM-AUS Radio Alerts

Alerts

Source: BOM-AUS
HF Comms Warning

HF Comms Warning

Current HF Fadeout

Current HF Fadeout

HF Fadeout Warning

HF Fadeout Warning

Polar Cap Absorption

Polar Cap Absorption

Geomagnetic Warning

Geomagnetic Warning

GEOSTAT Alert

GEOSTAT Alert

Geomagnetic Alert

Geomagnetic Alert

Aurora Alert

Aurora Alert

X-Ray Flux

X-Ray Flux

Proton Flux

Proton Flux

Interpretation

The Australian Bureau of Meteorology provides several space weather alerts related to radio communications:

  • HF Comms Warning: indicates that an HF propagation depression is expected or in progress, with ionospheric conditions likely to support lower-than-normal usable frequencies and potentially degraded HF communications.
  • Current HF Fadeout: during a solar flare, increased ionization in the D-region can cause enhanced absorption and reduced signal strength on HF propagation paths crossing the sunlit hemisphere. Depending on the intensity of the flare, this can result in partial or complete loss of HF communications.
  • HF Fadeout Warning: indicates that enhanced HF absorption due to solar X-ray activity is expected, with possible degradation or loss of HF communications on propagation paths crossing the sunlit hemisphere.
  • Polar Cap Absorption: indicates the severity of Polar Cap Absorption (PCA) using cosmic radio-noise absorption measurements at approximately 30 MHz from the riometer at Casey Station, Antarctica. Higher absorption values (dB) indicate stronger ionospheric absorption and potentially greater degradation of HF communications over polar paths.
  • Geomagnetic Warning: indicates that increased geomagnetic activity is expected, with the potential for disturbed ionospheric conditions and changes in HF propagation.
  • GEOSTAT Alert: provides an indication of the likelihood of an approaching geomagnetic storm. As the status progresses from GEOSTAT 5 toward GEOSTAT 0, the likelihood of a geomagnetic storm increases.
  • Geomagnetic Alert: indicates that significant geomagnetic activity is currently in progress, with possible disturbances to the ionosphere and HF propagation conditions.
  • Aurora Alert: indicates that space-weather conditions favourable for visible aurora are in progress. Enhanced auroral activity may also support auroral radio propagation, particularly at VHF frequencies, although signals can be strongly distorted by scattering from the auroral ionosphere.
  • X-Ray Flux: indicates the current solar X-ray flux. Enhanced X-ray emission during solar flares increases ionization in the D-region on the sunlit side of Earth, potentially causing increased HF absorption and radio blackouts.
  • Proton Flux: indicates alerts related to Solar Proton Events (SPEs). Elevated fluxes of energetic solar protons can increase ionization in the D-region at high geomagnetic latitudes, producing Polar Cap Absorption (PCA) and potentially severe degradation of HF communications over polar paths.

Spectrum Monitors

The Sun is a natural source of radio emissions whose intensity can increase dramatically during periods of solar activity. Solar radio bursts can raise the received noise level over a wide range of frequencies and reduce the signal-to-noise ratio (SNR) of radio communication and radionavigation systems. The effect is generally greatest when the Sun is within or near the receiving antenna\'s radiation pattern and can range from increased background noise to severe interference or temporary loss of reception.

Solar radio bursts are commonly classified into Types I to V according to their spectral and temporal characteristics. Type I bursts consist of short, narrowband emissions often associated with active regions; Type II bursts are slowly drifting emissions generally associated with shock waves propagating through the solar corona; Type III bursts exhibit rapid frequency drift and are produced by energetic electron beams travelling through the corona and interplanetary medium; Type IV bursts are broadband continuum emissions associated with energetic electrons in post-eruption magnetic structures; and Type V bursts are relatively short-lived continuum emissions that may follow Type III activity.

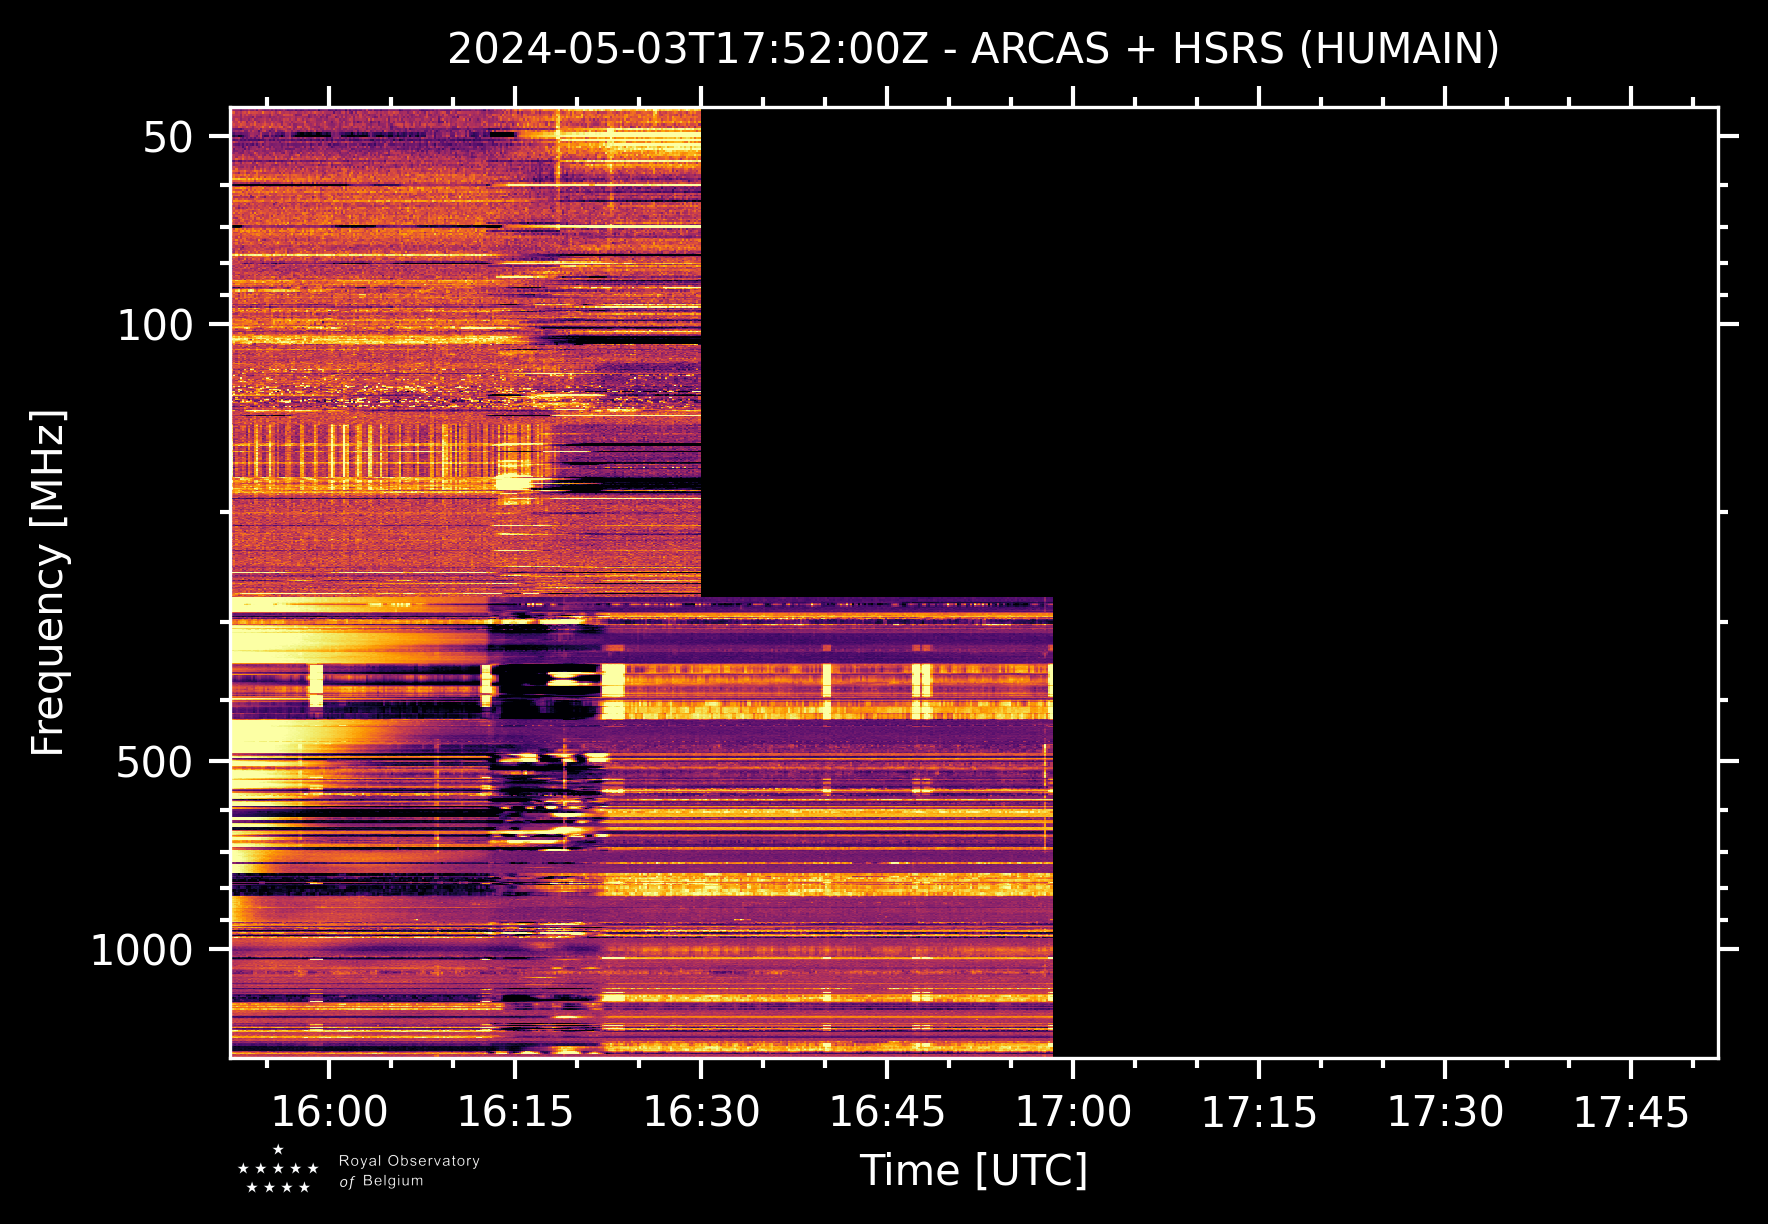
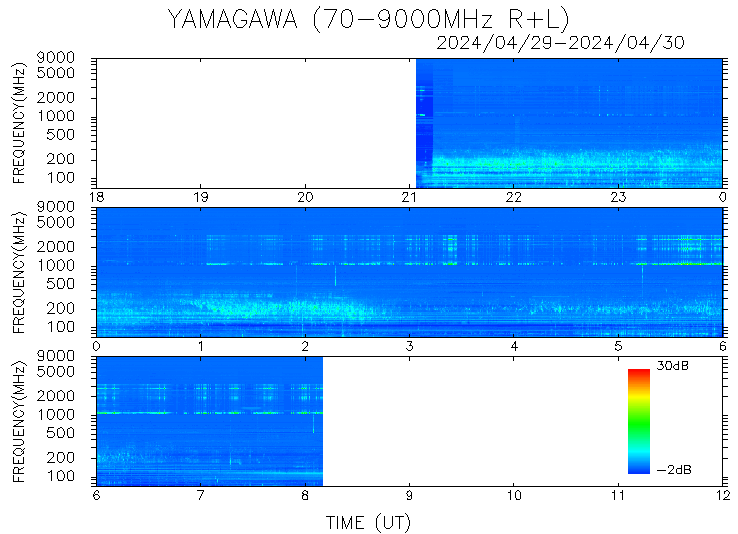
Spectrum monitors, or radio spectrographs, display received radio intensity as a function of frequency and time, making it possible to identify these solar radio emissions and follow their frequency evolution and intensity over time.

ARCAS and HSRS solar radio spectrographs in Belgium
ARCAS & HSRS Spectrographs (Belgium). 45-1495 MHz. Source: Solar Influences Data Analysis Center, Royal Observatory of Belgium.
Yamagawa solar radio spectrograph in Japan
Yamagawa Spectrograph (Japan). 70-9000 MHz. Source: NICT/Hiraiso Solar Observatory Courtesy of National Institute of Information and Communications Technology (NICT)
Interpretation

The images show solar radio spectrograms recorded by monitoring stations located in Belgium and Japan, covering different portions of the radio spectrum. Solar radio bursts can only be observed by a ground-based instrument while the Sun is above its local horizon. Consequently, combining observations from stations at different longitudes provides broader temporal coverage of solar radio activity.

HF Absorption

HF absorption occurs primarily in the D-region of the ionosphere, where collisions between electrons and neutral particles cause part of the radio-wave energy to be dissipated. During solar flares, enhanced X-ray emission can rapidly increase D-region ionization on the sunlit side of Earth, producing increased HF absorption. During Solar Proton Events (SPEs), energetic protons can produce enhanced D-region ionization at high geomagnetic latitudes, resulting in Polar Cap Absorption (PCA).

As a result, HF radio communications may experience increased attenuation and signal degradation, with lower frequencies generally suffering greater absorption than higher frequencies. During severe events, absorption may become strong enough to produce partial or complete HF radio blackouts over the affected regions.

Current HF fadeout map
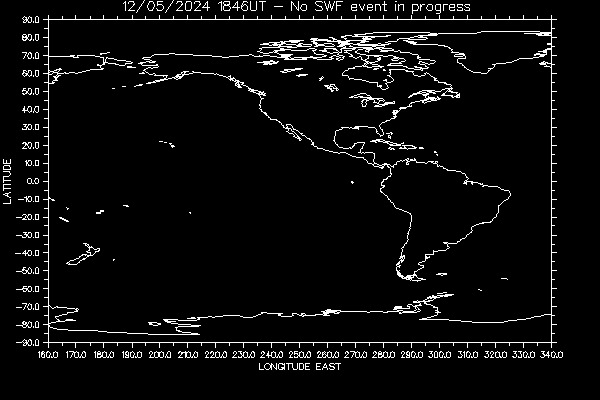
Current HF fadeout - Updated every 5 minutes Source: Australian Space Weather Alert System
HF fadeout map for the most recent significant event
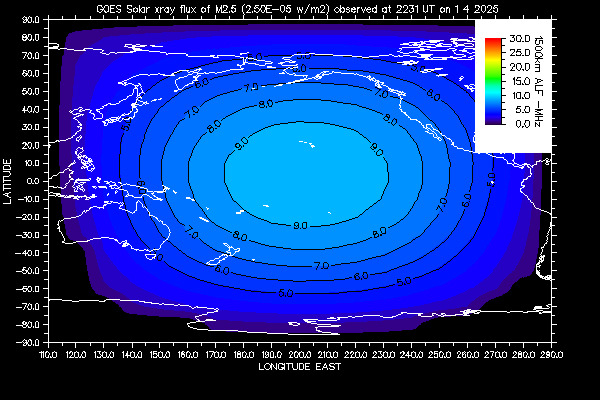
Last HF fadeout event (check the date) - Updated in accordance with solar activity Source: Australian Space Weather Alert System
Interpretation

The maps show the Absorption Limited Frequency (ALF), which represents the approximate lowest usable frequency imposed by ionospheric absorption for HF radio paths of approximately 1,500 km. Frequencies below the ALF are expected to experience excessive absorption, while frequencies above it are progressively less affected.

To interpret the map during an absorption event, estimate the location of the first ionospheric propagation region along the radio path and determine the corresponding ALF value from the contour lines. If the operating frequency is below the estimated ALF, excessive absorption may prevent reliable communication. Frequencies above the ALF but below the Maximum Usable Frequency (MUF) define the window that provides the most favourable conditions for establishing the radio link.

The first map displays the current estimated ALF, while the second shows the estimated ALF during the most recent significant absorption event (see the date indicated on the map).

Global D-region absorption prediction
Global D-region absorption prediction - Highest affected frequency by 1 dB absorption Source: NOAA/SWPC - DRAP2
Highest affected frequency by 10 dB absorption for North Pole radio paths
Highest affected frequency by 10 dB absorption (North Pole radio paths) Source: NOAA/SWPC - DRAP2
Highest affected frequency by 10 dB absorption for South Pole radio paths
Highest affected frequency by 10 dB absorption (South Pole radio paths) Source: NOAA/SWPC - DRAP2
Interpretation

The maps provided by NOAA display the Highest Affected Frequency (HAF), defined as the highest frequency predicted to experience a specified level of D-region absorption for vertical or near-vertical radio-wave propagation, as used in Near Vertical Incidence Skywave (NVIS) communications. The global map shows the HAF corresponding to 1 dB of absorption, while the polar-region maps show the HAF corresponding to 10 dB of absorption.

Radio signals operating at frequencies below the HAF are expected to experience progressively greater D-region absorption as the frequency decreases. On the global map, the absorption graph on the right-hand side shows the predicted absorption (in dB) as a function of frequency for vertical or near-vertical propagation at the location where the maximum absorption is predicted. The graph therefore applies only to that specific location.

To estimate the total absorption affecting an HF radio circuit:

  1. Estimate the location of the ionospheric region where first-hop HF-wave refraction takes place.
  2. Obtain the HAF from the NOAA DRAP2 tabular data. At this HAF, the attenuation figure is:
    A(HAF) = 1 dB
  3. A(Fver) = (HAF/F)3/2 dB
  4. For an oblique radio path with first-hop takeoff angle T
    A(Fob) = A(Fver) / sin(T)
  5. Repeat the process for each ionospheric region in which refraction occurs along the propagation path, and sum the results to obtain an estimate of the total absorption.

This procedure provides an approximate estimate of D-region absorption along the radio path. Actual signal attenuation may differ depending on the propagation geometry, ionospheric conditions, operating frequency, and the spatial distribution of absorption along the path.

D-region global absorption prediction at 5 MHz
D-region global absorption prediction at 5 MHz Source: NOAA/SWPC - DRAP2
D-region global absorption prediction at 10 MHz
D-region global absorption prediction at 10 MHz Source: NOAA/SWPC - DRAP2
D-region global absorption prediction at 15 MHz
D-region global absorption prediction at 15 MHz Source: NOAA/SWPC - DRAP2
D-region global absorption prediction at 20 MHz
D-region global absorption prediction at 20 MHz Source: NOAA/SWPC - DRAP2
D-region global absorption prediction at 25 MHz
D-region global absorption prediction at 25 MHz Source: NOAA/SWPC - DRAP2
D-region global absorption prediction at 30 MHz
D-region global absorption prediction at 30 MHz Source: NOAA/SWPC - DRAP2
Interpretation

The six maps show NOAA DRAP predictions of D-region absorption at 5, 10, 15, 20, 25, and 30 MHz for vertical or near-vertical radio-wave propagation, as used in Near Vertical Incidence Skywave (NVIS) communications. Each map shows the predicted absorption, in dB, at its corresponding operating frequency, as a consequence of solar X-ray flares or solar radiation storms leading to Polar Cap Absorption (PCA) events

For an oblique propagation path, if T is the takeoff angle of the radio wave above the local horizon, the corresponding absorption can be estimated using:

A(Fob) = A(Fver) / sin(T)

where A(Fver) is the absorption shown on the map for vertical or near-vertical propagation, and A(Fob) is the estimated absorption for the oblique propagation path.

The takeoff angle is related to the radiation pattern of the transmitting antenna, since the antenna determines how much radio-frequency energy is radiated at different elevation angles. The effective takeoff angle therefore depends on the antenna type, its height above ground, the characteristics of the surrounding terrain and ground, and the direction of propagation.

Each map represents the predicted D-region absorption for the specific operating frequency indicated. Absorption values from one frequency map should therefore not be applied directly to a different operating frequency.

Ionograms

When a radio wave reaches the ionosphere along a vertical or near-vertical path, as in Near Vertical Incidence Skywave (NVIS) propagation, it may be refracted sufficiently to return toward the Earth's surface if its frequency is below the critical frequency of the ionospheric layer involved. For the F2 layer, this threshold is known as the F2-layer critical frequency (foF2). This parameter can be measured using ionosondes, instruments that probe the ionosphere by transmitting radio pulses over a range of frequencies and measuring the returned signals.

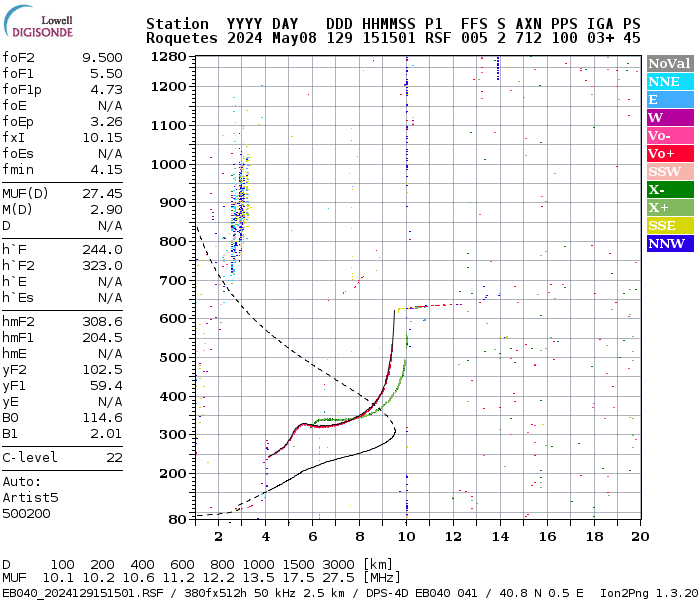
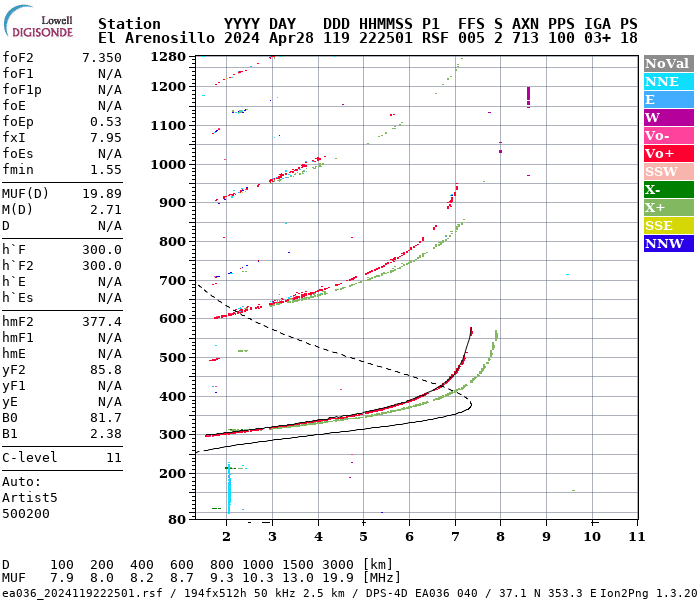
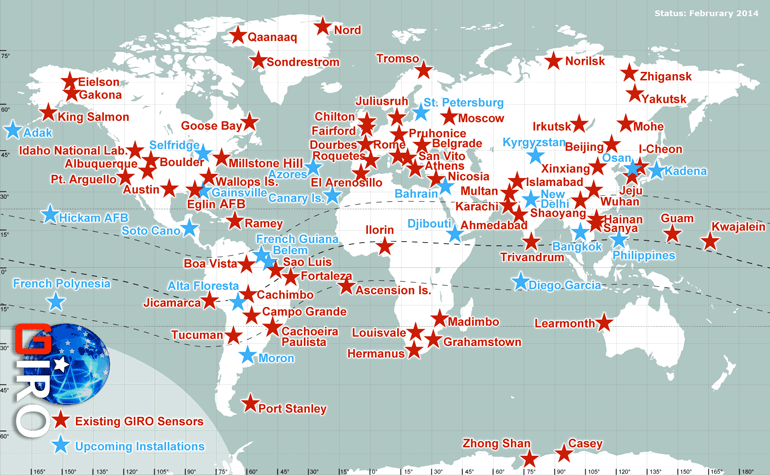
In Spain, two ionosonde stations provide publicly available data: the Ebro Observatory at Roquetes (Tarragona) and the National Institute for Aerospace Technology (INTA) at El Arenosillo (Huelva). The latest ionograms from these stations are shown below.

For ionograms and ionospheric data from other ionosonde stations around the world, please refer to the global ionosonde map below.

Latest ionogram from the Roquetes Station in Tarragona, Spain
Latest ionogram (not revised) from the Roquetes Station (Tarragona, Spain) - Updated every 10 minutes. Source: Ebre Observatory
Latest ionogram from the El Arenosillo Station in Huelva, Spain
Latest ionogram (not revised) from the El Arenosillo Station (Huelva, Spain) - Updated every 15 minutes. Source: Spanish National Institute for Aerospace Technology (INTA)
Interpretation

Interpreting ionosonde data can be a challenging task. Frequency (MHz) is represented on the X-axis, while virtual height (km) is represented on the Y-axis. Whenever the ionosonde detects an ionospheric echo at a particular frequency, a point is plotted at the corresponding frequency and virtual-height coordinates. Virtual height is an apparent height derived from the measured radio-wave travel time and should not be interpreted as the actual physical altitude of the ionospheric layer.

Derived ionospheric parameters are typically displayed on the left-hand side of the ionogram. These include parameters obtained from the ionogram, such as the F2-layer critical frequency (foF2), as well as calculated parameters such as the Maximum Usable Frequency for a 3000 km path (MUF(3000)).

Ionograms may be presented as raw or scaled ionograms. A raw ionogram displays the received ionospheric echoes before interpretation, whereas a scaled ionogram includes parameters identified or calculated from those echoes, either by automatic ionogram-scaling software or by manual analysis. Automatically scaled values should be interpreted with some caution, particularly when the ionogram contains interference, spread-F, weak or complex traces, or other disturbed ionospheric conditions.

At the bottom of the ionogram, estimated MUF values for different path lengths may be provided. These values are derived from the ionospheric conditions measured at the ionosonde location and can be useful for estimating suitable frequencies for oblique HF propagation paths. However, because ionospheric conditions can vary significantly along a radio path, these MUF values should be regarded as estimates rather than direct measurements of the MUF between two distant stations.

Radio operators using Near Vertical Incidence Skywave (NVIS) should monitor the current foF2 value measured by the nearest ionosonde in order to get the upper frequency limit for NVIS operation.

Worldwide network of Lowell ionosondes
Worldwide network of Lowell ionosondes Source: Center for Atmospheric Research, University of Massachusetts Lowell

foF2 Maps

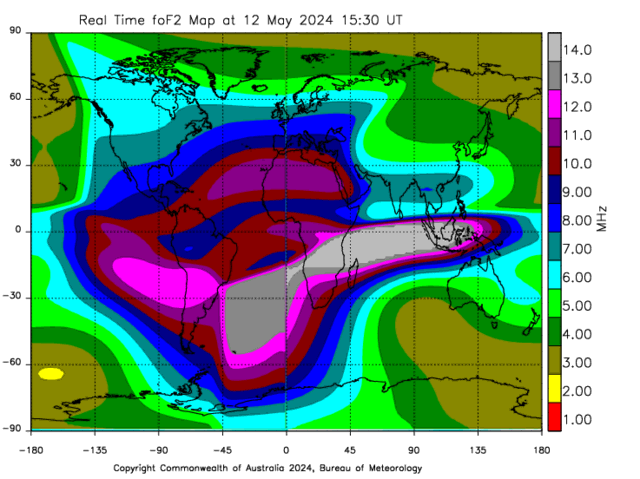
The Australian Space Weather Forecasting Centre (ASWFC) provides global ionospheric maps of the F2-layer critical frequency (foF2), derived from observations obtained by a worldwide network of ionosondes. These maps provide a regional representation of F2-layer ionization and allow variations in foF2 to be followed over time.

Current foF2 world map
Current foF2 - World Map - Updated every 1-hour intervals Source: Australian Space Weather Alert System
Interpretation

The map shows a regional extrapolation of the F2-layer critical frequency (foF2) derived from measurements obtained by nearby ionosondes. These values provide an approximate indication of the highest frequency that can support vertical or near-vertical propagation, making them particularly useful for estimating suitable operating frequencies for Near Vertical Incidence Skywave (NVIS) communications.

NVIS communications use radio waves transmitted at high elevation angles, requiring antennas with radiation patterns that provide significant energy at these angles. The waves are refracted by the ionosphere and returned to Earth, enabling communications over distances of up to approximately 500 km while minimizing or eliminating the skip zone (shadow area) normally associated with lower-angle skywave propagation.

foF2 variations due to geomagnetic activity

During geomagnetic storms, disturbances in the near-Earth space environment can produce significant changes in the electron density of the F2 region, resulting in corresponding variations in the F2-layer critical frequency (foF2). Geomagnetic storms may be driven by coronal mass ejections (CMEs) or by high-speed solar-wind streams and their associated interaction regions. The resulting ionospheric disturbances can significantly affect HF radio communications.

Geomagnetic storms can produce either increases or decreases in F2-region electron density, resulting in corresponding changes in foF2 and the Maximum Usable Frequency (MUF). During a positive ionospheric storm phase, enhanced electron density may increase foF2 and MUF, potentially improving propagation at higher HF frequencies. During a negative ionospheric storm phase, reduced electron density lowers foF2 and MUF, potentially degrading HF propagation and, in severe cases, causing the loss of established radio circuits.

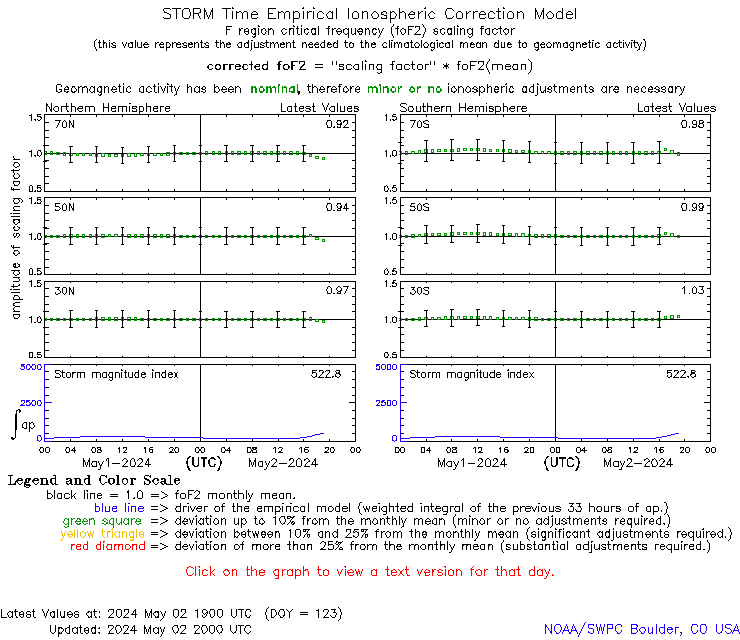
STORM Time Empirical Ionospheric Correction Model
STORM Time Empirical Ionospheric Correction Model Source: NOAA/SWPC
Interpretation

This NOAA Space Weather Prediction Center (SWPC) plot shows the STORM-time foF2 scaling factor, which represents the estimated modification of F2-layer critical frequency (foF2) during geomagnetically disturbed conditions relative to quiet-time conditions. The scaling factor can be multiplied by a quiet-time foF2 value to estimate the corresponding foF2 under disturbed ionospheric conditions.

The graph shows how the foF2 correction factor varies during geomagnetic storms. Since changes in foF2 also affect the Maximum Usable Frequency (MUF), the graph provides an indication of the expected effect of disturbed ionospheric conditions on HF propagation. Separate curves are provided for the Northern and Southern Hemispheres and for three representative geomagnetic latitudes: 30°, 50°, and 70°.

Scaling-factor values close to 1.0 indicate that the estimated foF2 remains close to its quiet-time value, corresponding to relatively small geomagnetic-storm corrections to the reference ionospheric conditions.

Scaling-factor values greater than 1.0 indicate a positive ionospheric storm effect, with foF2 increased relative to its quiet-time value. The associated increase in MUF may allow higher HF frequencies to support ionospheric propagation than under normal conditions.

Scaling-factor values less than 1.0 indicate a negative ionospheric storm effect, with foF2 decreased relative to its quiet-time value. The associated decrease in MUF may prevent higher HF frequencies from supporting ionospheric propagation, potentially degrading or closing established radio circuits.

For current foF2 measurements derived from ionosonde observations, please refer to the Ionograms section.

MUF(3000)

The International Union of Radio Science (URSI) defines the Maximum Usable Frequency (MUF) as "the highest frequency that can be used for ionospheric transmission between two specified locations at a given time using a specified propagation mode."

Since ionospheric propagation generally occurs via oblique paths, using low takeoff angles to maximize link distance, the MUF depends on the geometry of the radio circuit. Consequently, different distances between radio stations will result in different Maximum Usable Frequency (MUF) values for the corresponding radio links.

The Maximum Usable Frequency for a 3000 km path, MUF(3000), is the highest frequency expected to support ionospheric propagation between two points separated by approximately 3,000 km, under the prevailing ionospheric conditions and for the propagation mode considered. It is derived from ionospheric parameters such as foF2 and provides a useful indication of the upper frequency limit for long-distance HF radio communications.

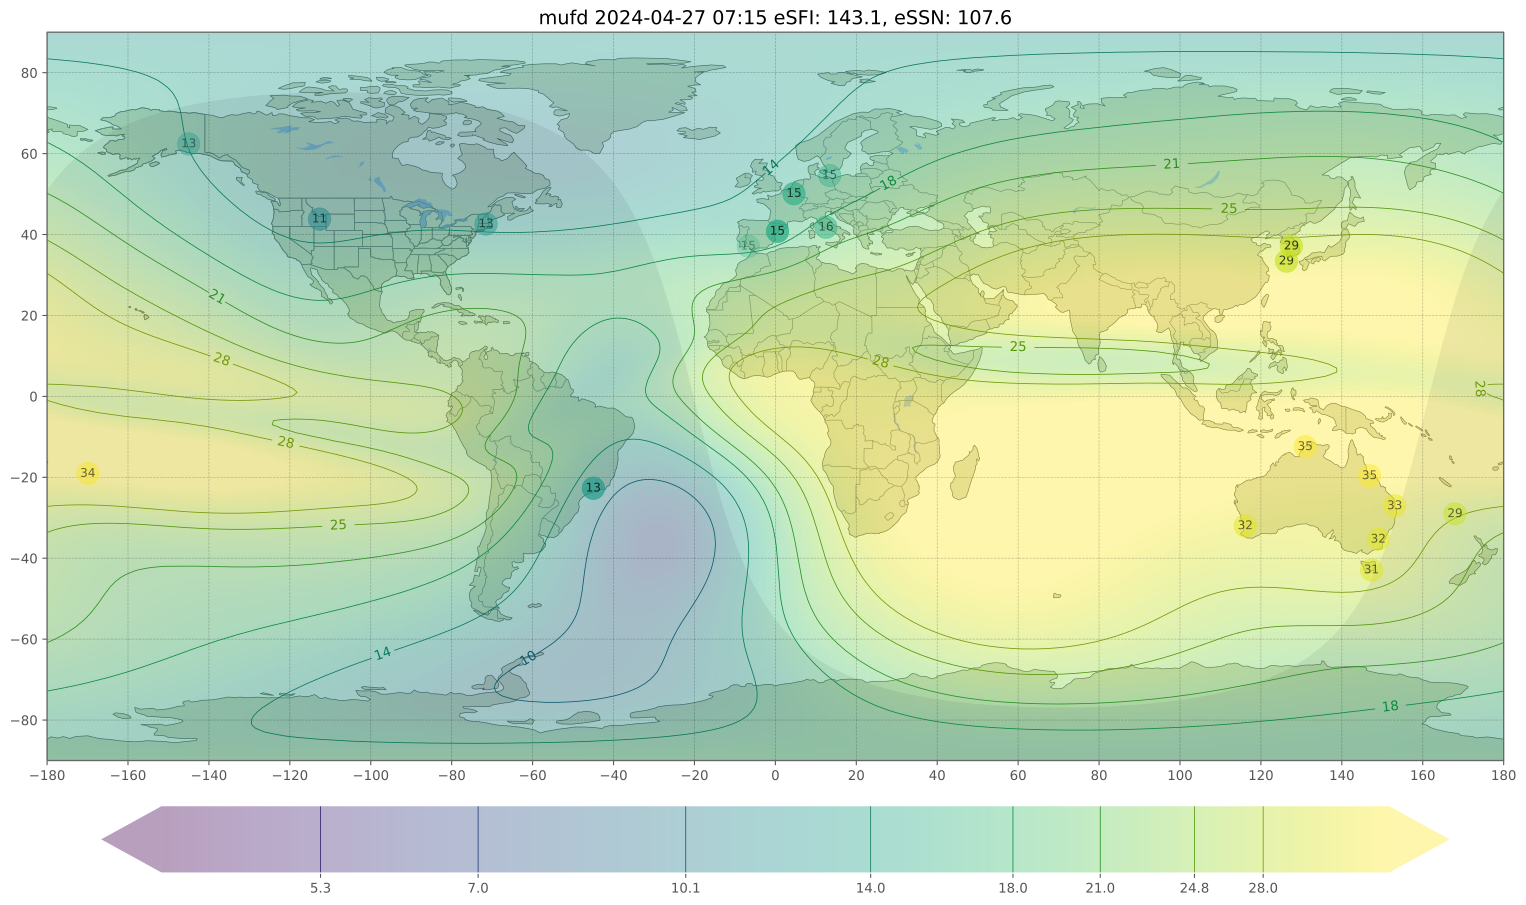
Predicted MUF for 3000 km radio paths
Predicted MUF for 3000 km radio paths - Updated every 15 minutes Source: K2CG (prop.kc2g.com)
Interpretation

This map, developed by Andrew Rodland (KC2G), provides a global representation of MUF(3000) based on ionosonde observations and spatial interpolation. It forms part of an open-source project available on GitHub and was presented at the HamSCI 2021 Conference. The map uses ionospheric data from NOAA's National Centers for Environmental Information (NCEI) and the Global Ionospheric Radio Observatory (GIRO).

The numbers shown inside the circles represent MUF(3000) values derived from ionograms recorded by local ionospheric sounding stations located at those positions. The MUF(3000) values between stations are estimated through spatial interpolation, providing a continuous representation of the expected geographical variation in MUF(3000).

To estimate the Maximum Usable Frequency (MUF) for a radio path using this map:

3000 km paths

  • Estimate the geographical midpoint of the radio path, which approximates the ionospheric region controlling the MUF for a single-hop 3000 km circuit.
  • Determine the corresponding MUF(3000) from the map color scale.

4000 km paths

  • Estimate the geographical midpoint.
  • Determine MUF(3000) from the map color scale.
  • As an approximation, multiply MUF(3000) by 1.1 to estimate the MUF for a 4000 km path.

Paths longer than 4000 km

  • Divide the radio path into approximately equal 3000 km or 4000 km propagation segments, choosing the length that best represents the total path.
  • Identify the segments at the two ends of the radio path.
  • Estimate the MUF for each end segment with the corresponding 3000/4000 procedure.
  • As an approximation, use the lower of the two calculated MUF values as the complete circuit MUF, since the more restrictive end can limit the maximum frequency.

Online MUF Calculators

A variety of free online software tools are available for HF propagation prediction and Maximum Usable Frequency (MUF) estimation. These tools use different propagation models and input parameters, which may include the locations of the transmitting and receiving stations, date and time, operating frequency, solar activity indices, geomagnetic conditions, antenna characteristics, and other radio-path parameters. In addition to MUF estimates, some tools can predict radio-circuit performance at a specified frequency, including parameters such as signal-to-noise ratio (SNR).
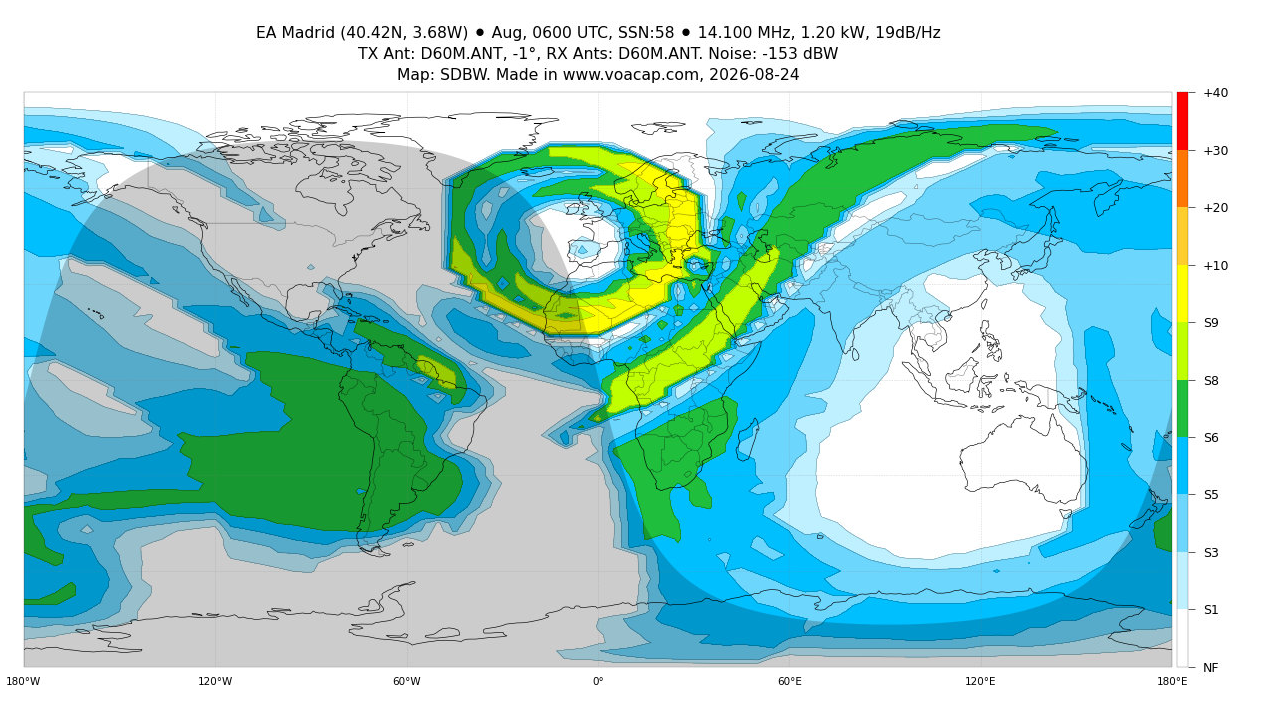
VOACAP Online

VOACAP Online example

VOACAP is professional HF (3–30 MHz) propagation-prediction software developed by NTIA/ITS, with its origins in systems developed for the Voice of America (VOA). VOACAP Online, developed by Jari Perkiömäki (OH6BG), James Watson (HZ1JW), and Juho Juopperi (OH8GLV), provides web-based point-to-point propagation predictions and coverage maps without requiring the VOACAP software to be installed locally.

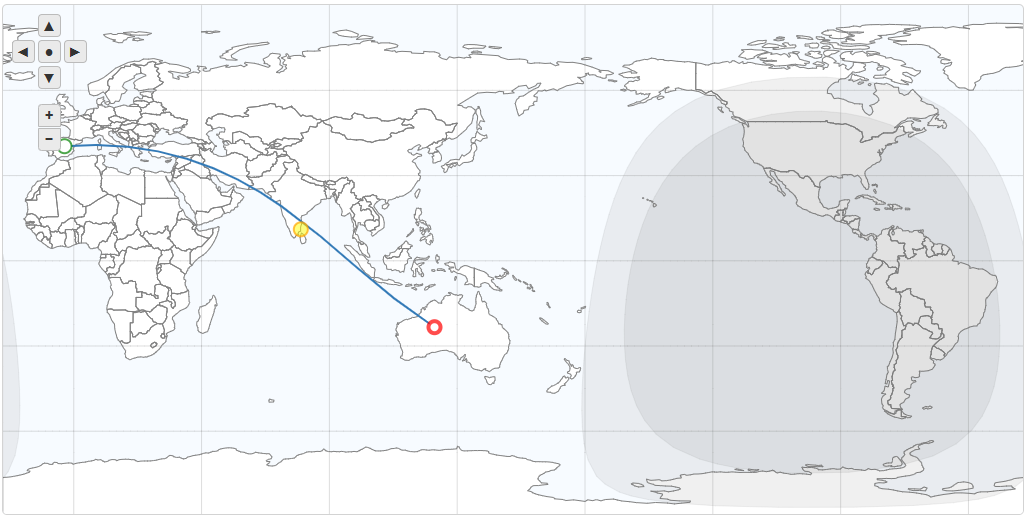
HF Prediction (BOM-AUS)

Australian Space Weather HF Prediction example

The Australian Space Weather Forecasting Centre (ASWFC), operated by the Bureau of Meteorology, provides online tools for HF radio-propagation prediction and analysis. These include point-to-point HF propagation predictions, HF aeronautical communication forecasts, Hourly Area Predictions (HAP), area-coverage predictions for specified operating frequencies, and estimates of the Upper, Recommended, Secondary, and Lower (URSL) HF frequencies.

Grey Line

The grey line is the boundary between the day side and night side of Earth, also known as the solar terminator. As this boundary moves across the planet, ionospheric conditions change rapidly. In particular, electron density in the D-region, which is responsible for most HF radio-wave absorption, decreases rapidly after sunset, significantly reducing absorption, while ionization begins to increase again after sunrise.

HF propagation can sometimes be enhanced along or near the grey line, particularly around local sunrise and sunset, because the different ionospheric regions respond to changing solar illumination at different rates. On the night side of the terminator, ionization in the D-region decreases rapidly after sunset, greatly reducing HF absorption, while the E- and F-regions decay more slowly and may remain sufficiently ionized to refract HF radio waves back toward Earth. On the day side of the terminator, solar radiation maintains stronger ionization in the E- and F-regions, supporting ionospheric propagation, although increasing ionization in the D-region also produces greater absorption. Consequently, radio paths located along or crossing the terminator can sometimes combine relatively low D-region absorption on the night side with sufficient ionization in the higher ionospheric regions to support long-distance propagation, producing favourable conditions for HF communications and, in some cases, unusually long-distance contacts (DX).
Current position of the Grey Line
Current position of the Grey Line Source: Fourmilab Earth and Moon Viewer
Interpretation

The figure shows the current position of the grey line (day-night terminator) and the corresponding day and night regions across the world. It can be used to determine whether a radio path, or either of its endpoints, is approaching local sunrise or sunset, helping to identify periods when grey-line propagation may enhance HF communications. The map is also useful for identifying geographic regions on the sunlit side of Earth that may be affected by solar events, such as HF radio blackouts caused by enhanced X-ray emissions during solar flares, or interference caused by solar radio-noise events, which can be monitored using spectrum monitors.

HF Radio & Space Weather is a resource dedicated to the operational monitoring of space weather and HF propagation conditions.

This is an educational, non-commercial website. All displayed data is property of their authors and credit and hyperlinks to the corresponding sources are provided. If you want to contact the webmaster, please use this form.