Solar Activity
Monitoring of solar radiation, solar imagery, solar flux and sunspot activity.
Introduction
Solar activity can significantly influence the Earth's ionosphere and, consequently, the propagation of radio waves. The Sun emits electromagnetic radiation across a broad range of wavelengths, including extreme ultraviolet (EUV) and X-ray radiation, whose photons possess sufficient energy to excite atoms and molecules in the ionosphere, a layer of the atmosphere located at altitudes between 50 and 965 km (30-600 mi). This excitation can cause these molecules to dissociate into two atoms and may even result in the loss of some of their electrons, a process known as ionization. Depending on the region of the ionosphere in which ionization occurs, different effects will be observed: in the E and F Regions, the refraction of HF radio waves is enhanced, whereas in the D-region, their absorption is enhanced.
Solar EUV radiation (wavelength between 100 and 1200 angstroms) is the most important source of ionization in the E and F regions of the ionosphere. Variations in this radiation therefore influence ionospheric electron density and the frequencies that can be supported by ionospheric propagation, making a big difference between daytime and nighttime:
- During the day, the EUV radiation continuously creates and maintains the ionospheric E and F regions.
- During the night, the EUV source disappears, recombination reduces electron densities, the D layer largely vanishes, and the F region weakens and changes its structure.
Enhanced ionization in the upper ionosphere contributes to higher Maximum Usable Frequencies (MUFs) for HF radio communications.
Solar X-rays (with wavelengths between 8 and 20 angstroms) are much more energetic and penetrate into lower layers of the ionosphere, potentially affecting ionization in the D-region, where they primarily enhance the absorption or attenuation of HF radio waves.
The following sections provide near-real-time observations and indicators of solar activity, including solar X-ray flux, solar imagery, solar radio flux, and sunspot activity, together with information useful for assessing their possible effects on HF radio propagation.
Solar X-Rays
A solar flare is a massive eruption of electromagnetic radiation that occurs on the Sun and can last from minutes to hours. This sudden release of electromagnetic energy travels at the speed of light and, if it is geoeffective, reaches the sunlit side of the Earth in approximately 8 minutes.
Part of the radiation released during a solar flare is emitted in the X-ray band. When this radiation reaches the sunlit side of the Earth, it increases ionization in the lower ionosphere, particularly in the D-region.
When an HF radio wave propagates through this ionized plasma in the D-region, its electric field causes free electrons to oscillate. These electrons undergo frequent collisions with neutral molecules in the atmosphere, transferring part of their energy to the surrounding gas in the form of heat.
As a result, the radio wave loses energy as it passes through the D-region, leading to increased attenuation or absorption of the HF signal. During periods of intense solar flare activity, this process can severely degrade HF radiocommunications and, in extreme cases, cause HF radio blackouts.
The following graphs display near real-time data on the flux density of ionizing radiation in the X-ray band originating from the Sun, as measured by NOAA's GOES-18 and GOES-19 satellites.
These satellites are located at different longitudes within the geostationary orbit, so they can continuously monitor different sectors of the Earth and the Sun. Both use the EXIS instrument suite (Extreme Ultraviolet and X-ray Irradiance Sensors), specifically its X-Ray Sensor (XRS), in order to constantly measure the radiation density flux in the X-Ray band in two broadband channels: 1-8 Å (0.1-0.8 nm) and 0.5-4 Å (0.05-0.4 nm)
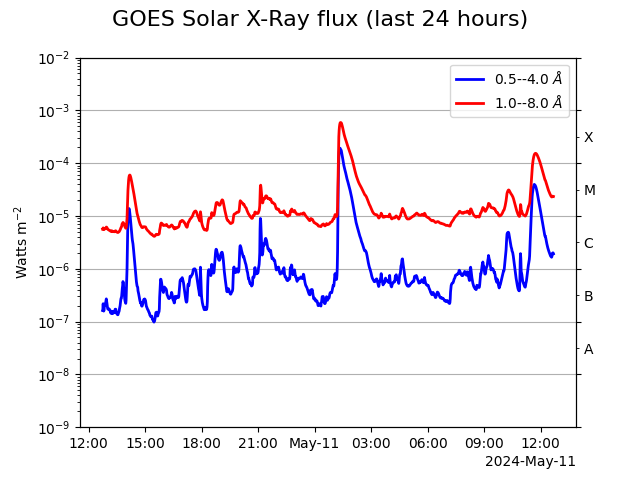
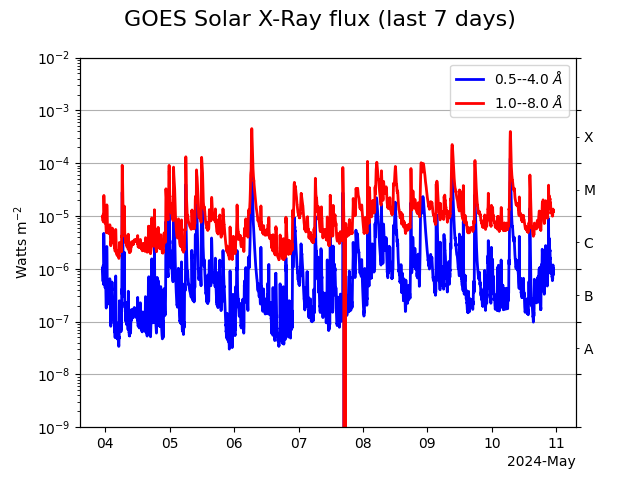

Solar flares can produce rapid increases in the Sun's X-ray emission. NOAA's GOES satellites continuously monitor this emission, and the measured X-ray flux is used to classify solar flares according to their peak flux in the 0.1–0.8 nm wavelength band.
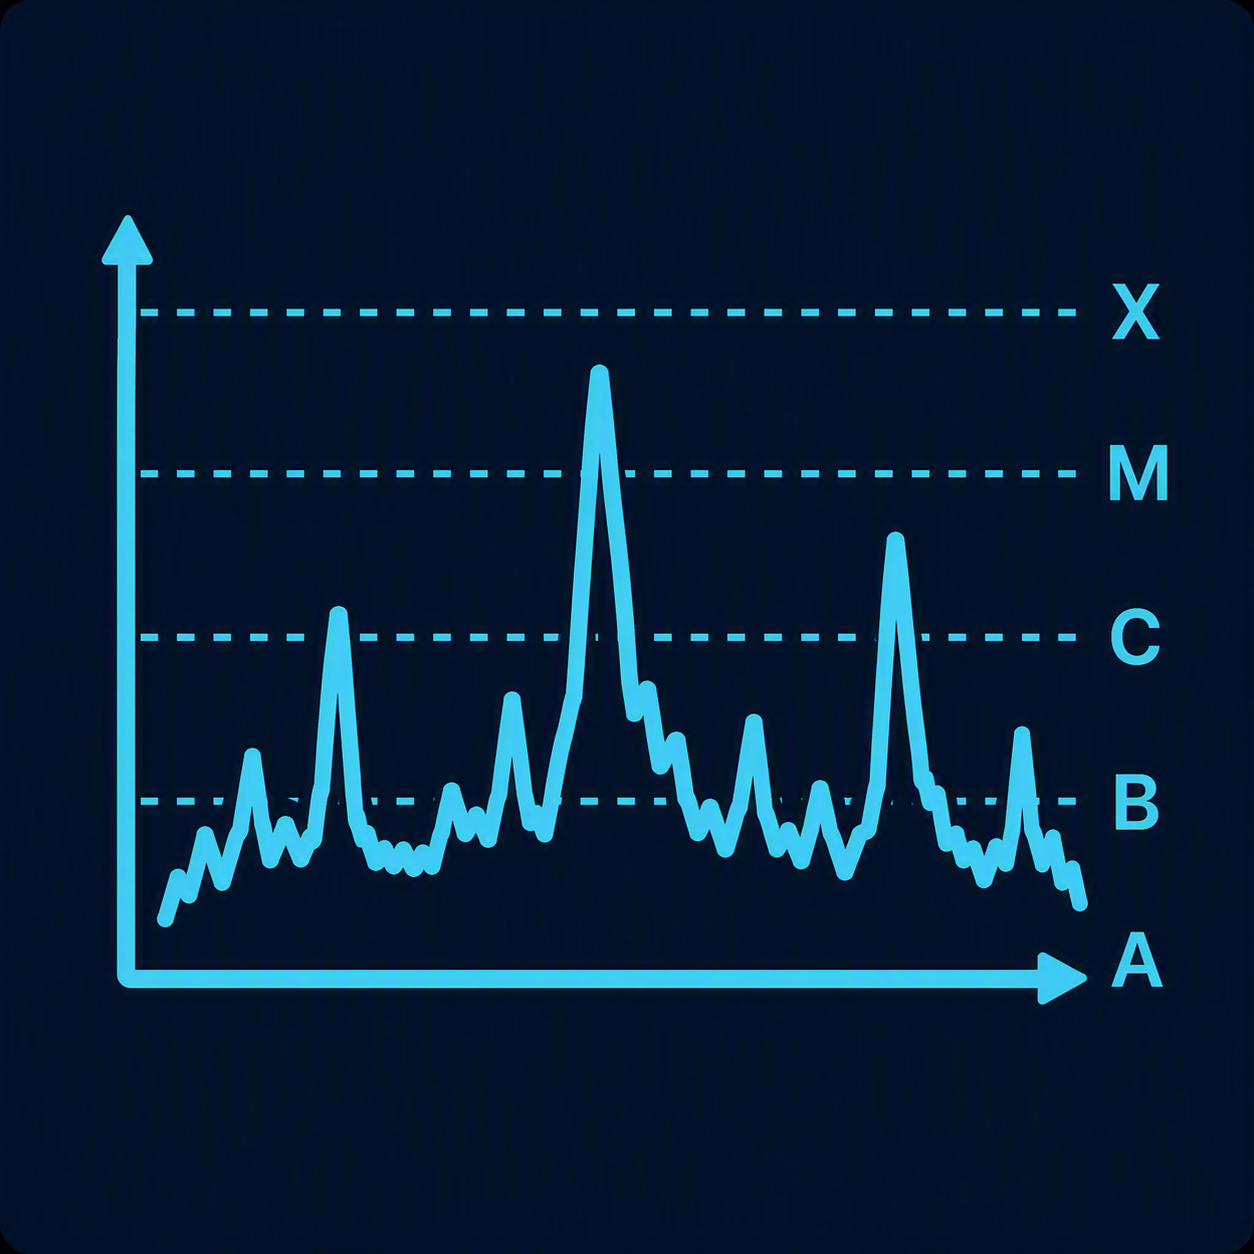
Solar flares are classified as A, B, C, M, or X, with each class representing a tenfold increase in X-ray flux. A numerical multiplier specifies the intensity within each class; for example, an M5 flare is five times stronger than an M1 flare in terms of peak 0.1–0.8 nm X-ray flux. The X class has no fixed upper limit, so particularly intense events may be classified as X10, X20, or higher.
Enhanced X-ray radiation from a solar flare reaches Earth approximately 8 minutes after leaving the Sun and increases ionization in the lower ionosphere on the sunlit side of Earth, particularly in the D-region. This enhanced ionization increases HF radio-wave absorption and may produce a short-wave fadeout or radio blackout. The stronger the flare, the greater the potential absorption, although the actual impact on a particular radio circuit also depends on factors such as frequency, solar illumination, and propagation-path geometry.
NOAA classifies flare-related radio blackouts using the R scale, from R1 (Minor) to R5 (Extreme). R1 begins with an M1-class flare, while progressively stronger X-class flares correspond to the higher radio-blackout categories.
The GOES X-ray measurements therefore provide a useful near-real-time indication of solar-flare activity and its potential effects on HF radio communications.
During or following a major solar flare, please check the Spectrum Monitors and the HF Absorption Levels in the Radio Communications section, which may be significant during intervals of minutes to hours. The plots in this section have been generated with raw data provided by NOAA, using the SunPy Python package, a comprehensive data analysis environment for solar physics.
ASWAS: Recent flare and fadeout information (larger than C8 only)
Reports
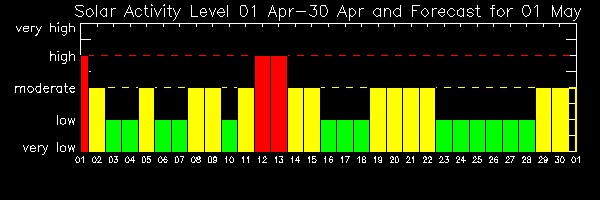
The graph, provided by the Australian Space Weather Forecasting Centre, shows the level of solar activity over the past month, with daily granularity and updates every 24 hours. The activity level is displayed on a five-level scale: very low, low, moderate, high, and very high.
At least once per day, the Big Bear Solar Observatory (BBSO) provides Daily Solar Activity Reports, which include inspections of active solar regions. An Active Region (AR) is a localized area on the Sun where the magnetic field is significantly stronger and more complex than in the surrounding solar atmosphere. Active regions are commonly associated with phenomena such as solar flares, coronal mass ejections (CMEs), extreme ultraviolet brightenings, X-ray emissions, and solar radio bursts.
In confirmed cases, the BBSO also issues Solar Activity Early Warnings, which contain predictions of rapid evolution and/or energetic solar flares in individual sunspot groups.
Solar Imagery
Solar Dynamics Observatory (SDO)
The Solar Dynamics Observatory (SDO) is a NASA spacecraft designed to study solar activity and its influence on space weather. One of its principal instruments is the Atmospheric Imaging Assembly (AIA), which continuously observes the full solar disk at multiple extreme-ultraviolet (EUV) and ultraviolet (UV) wavelengths, allowing different regions and temperatures of the solar atmosphere to be studied.
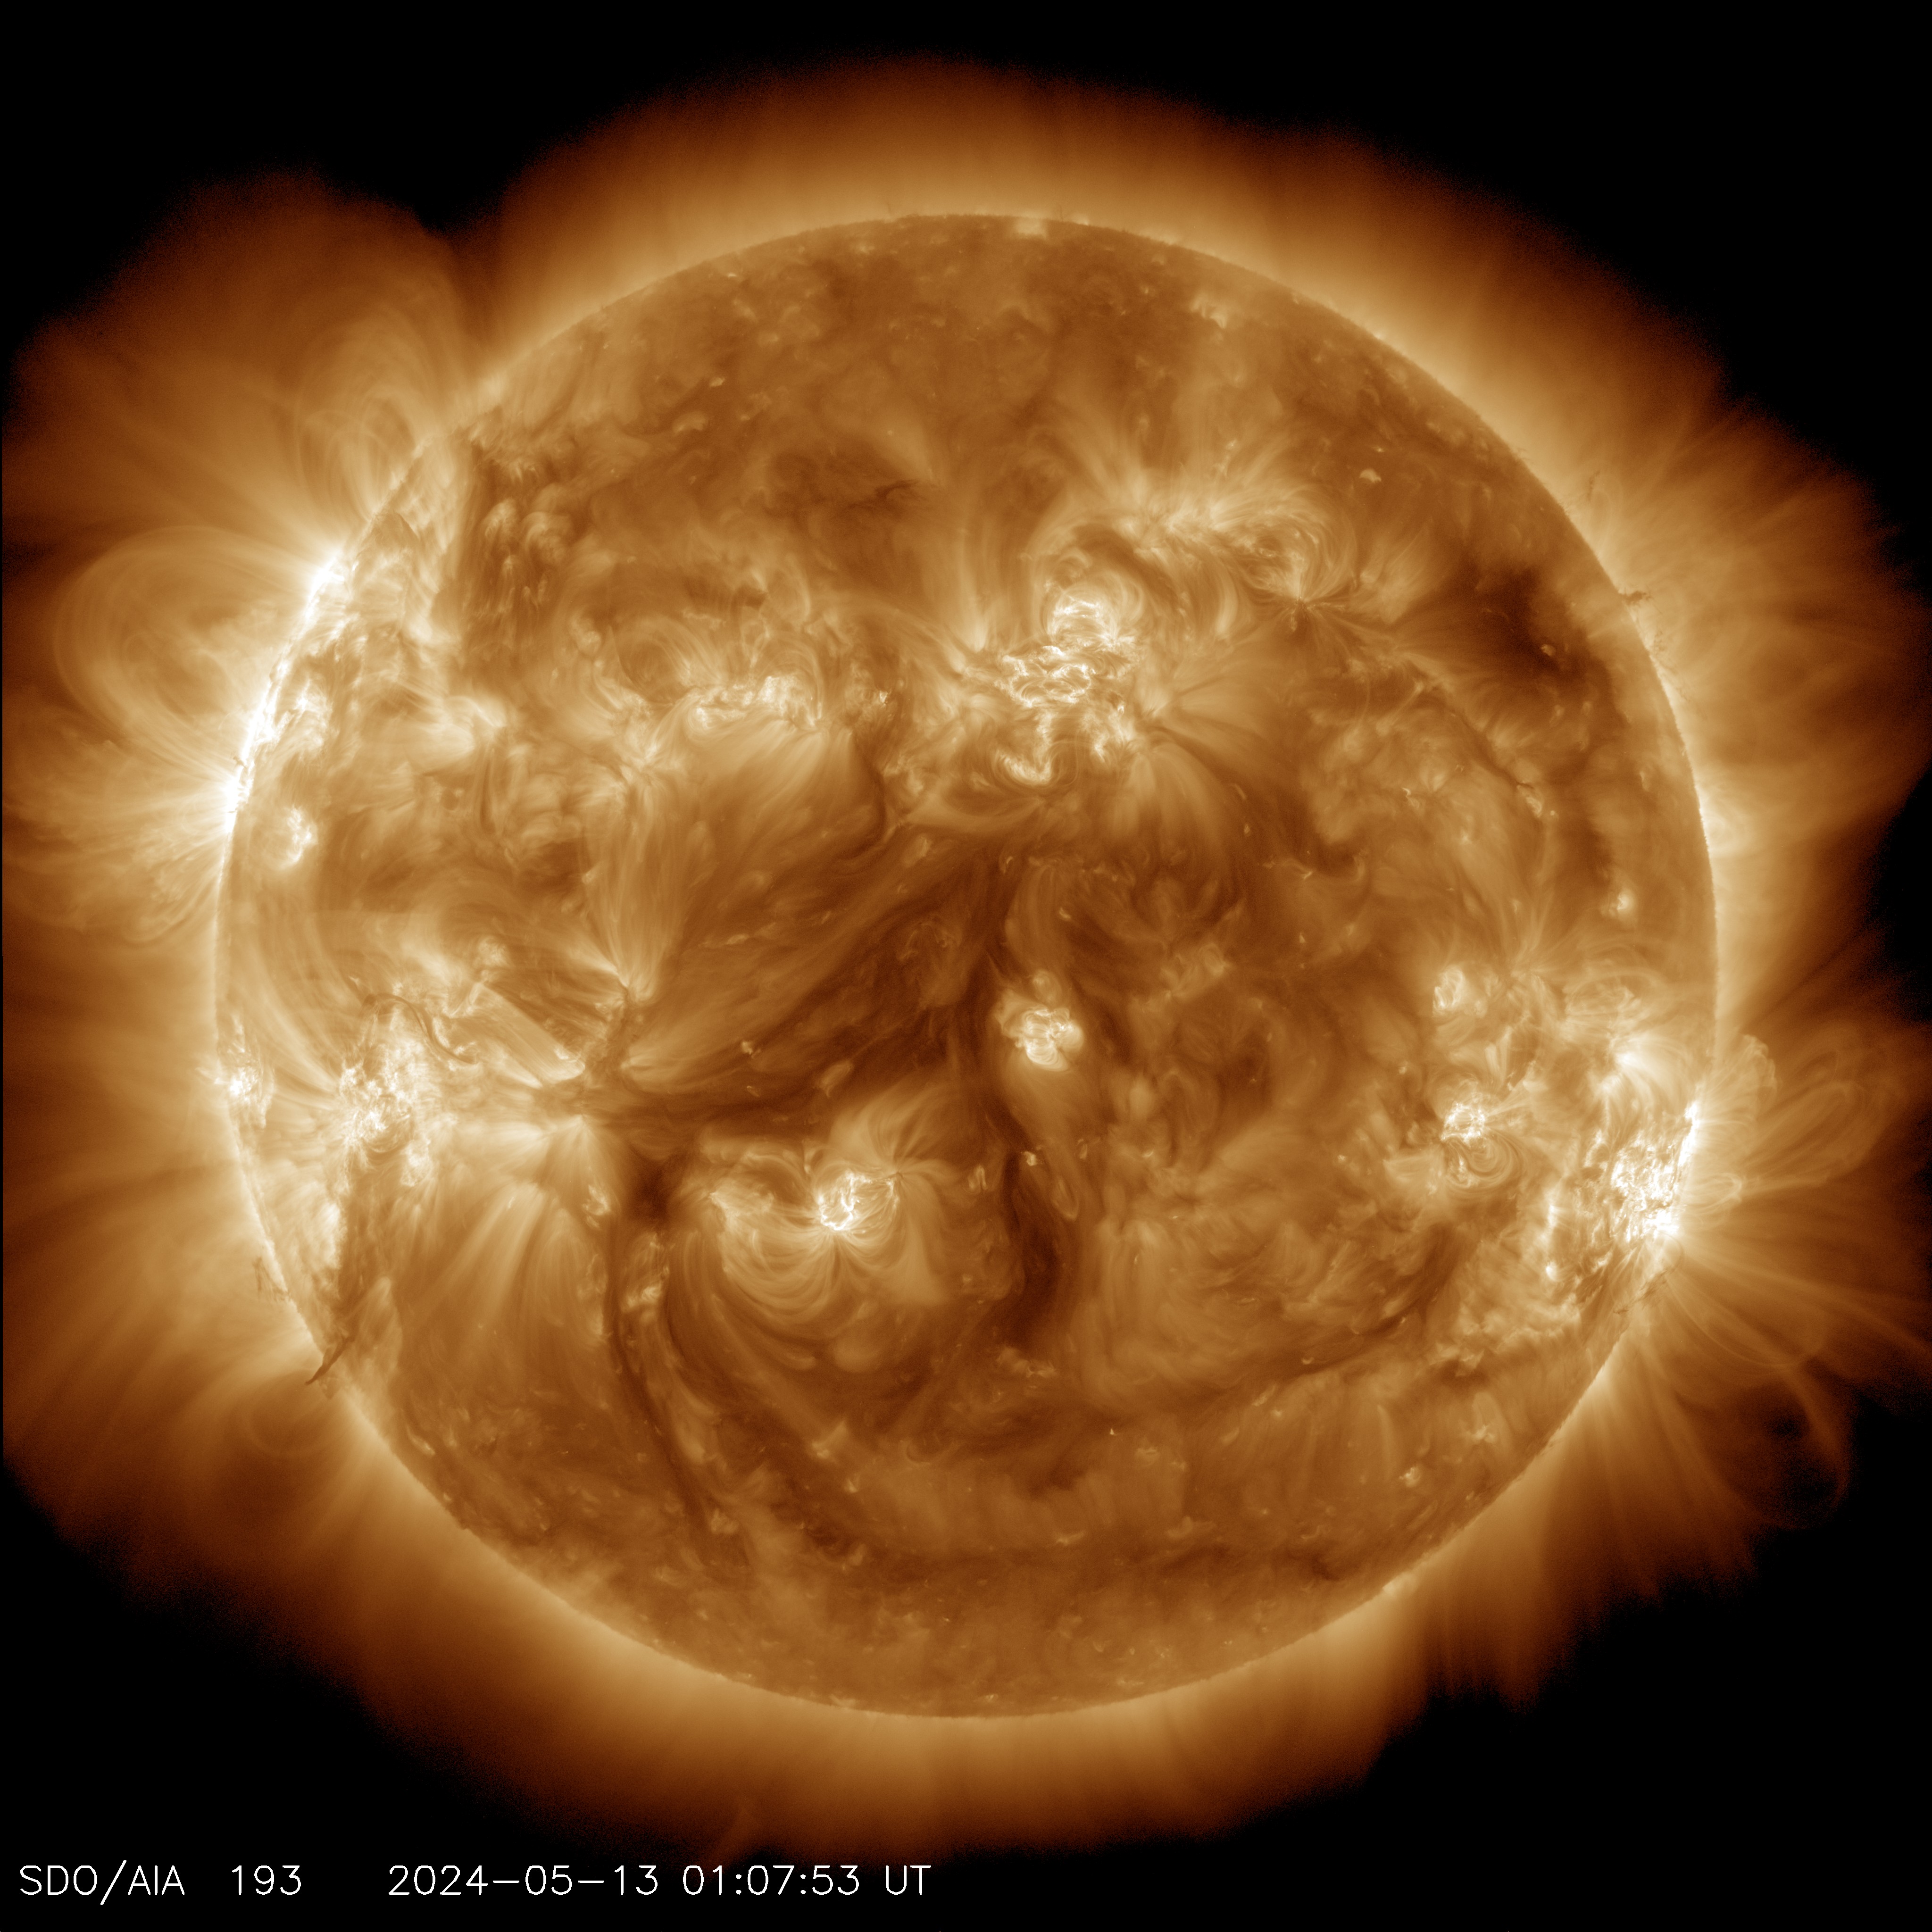
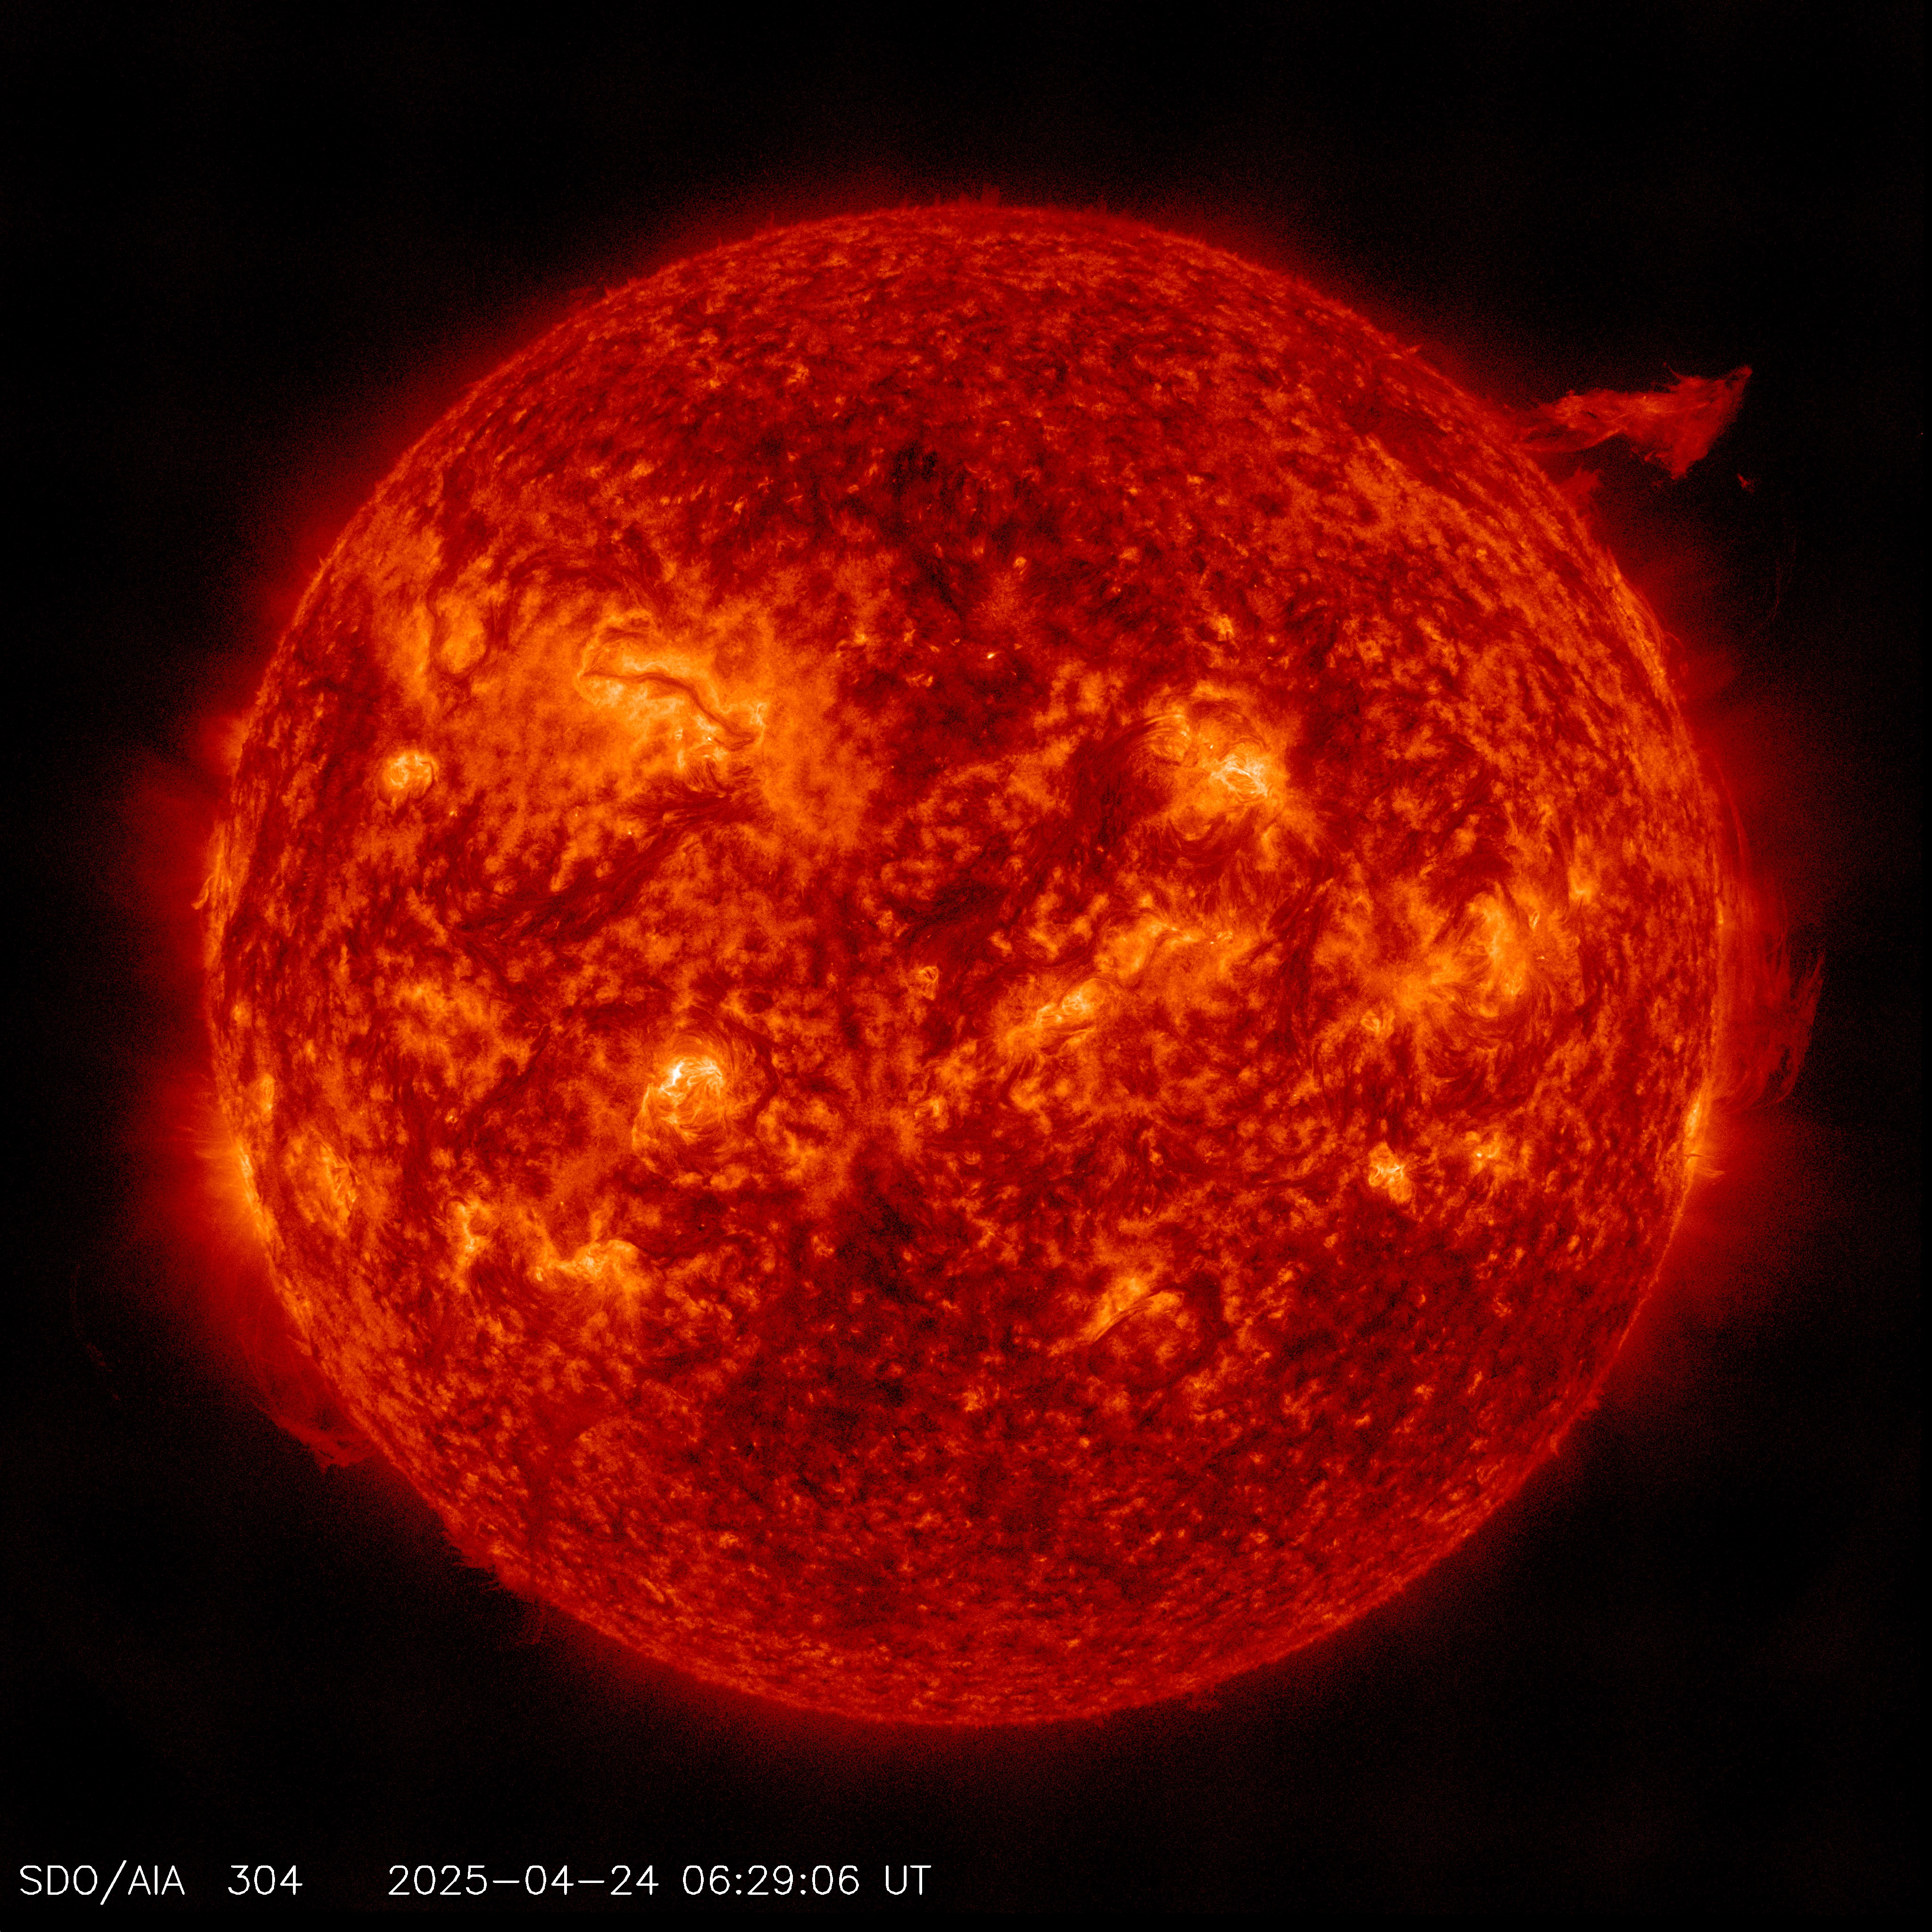
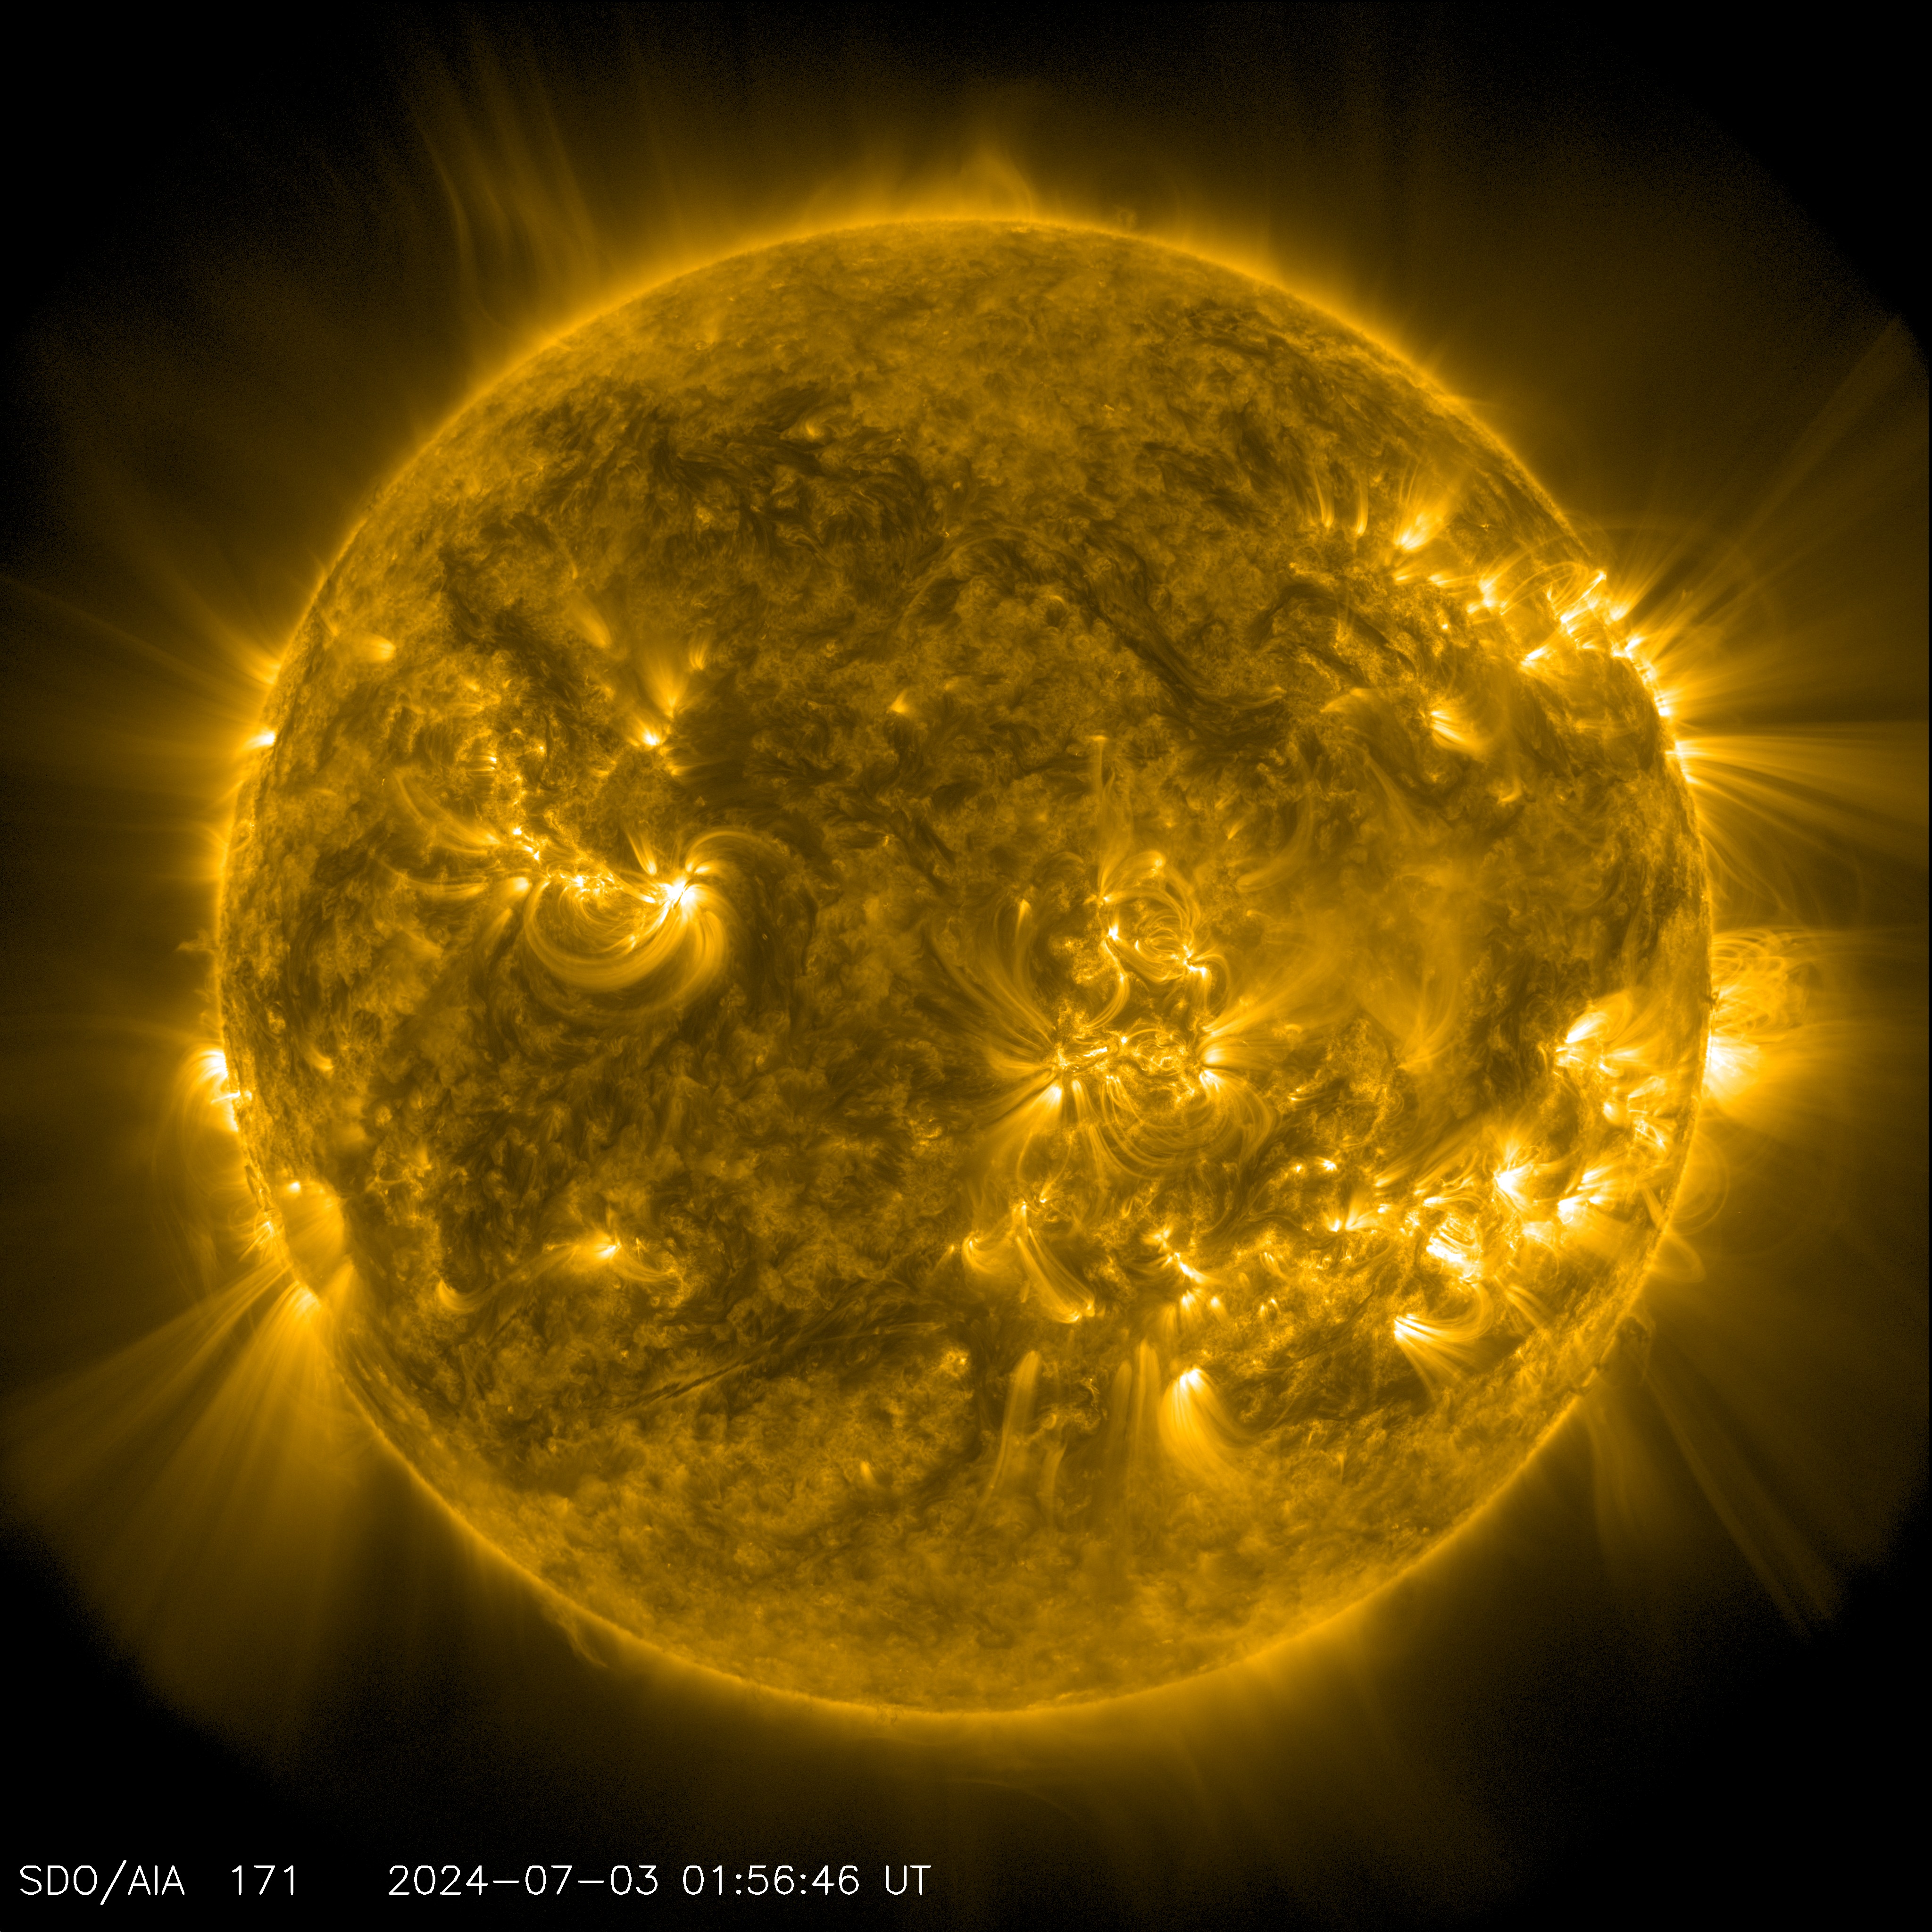
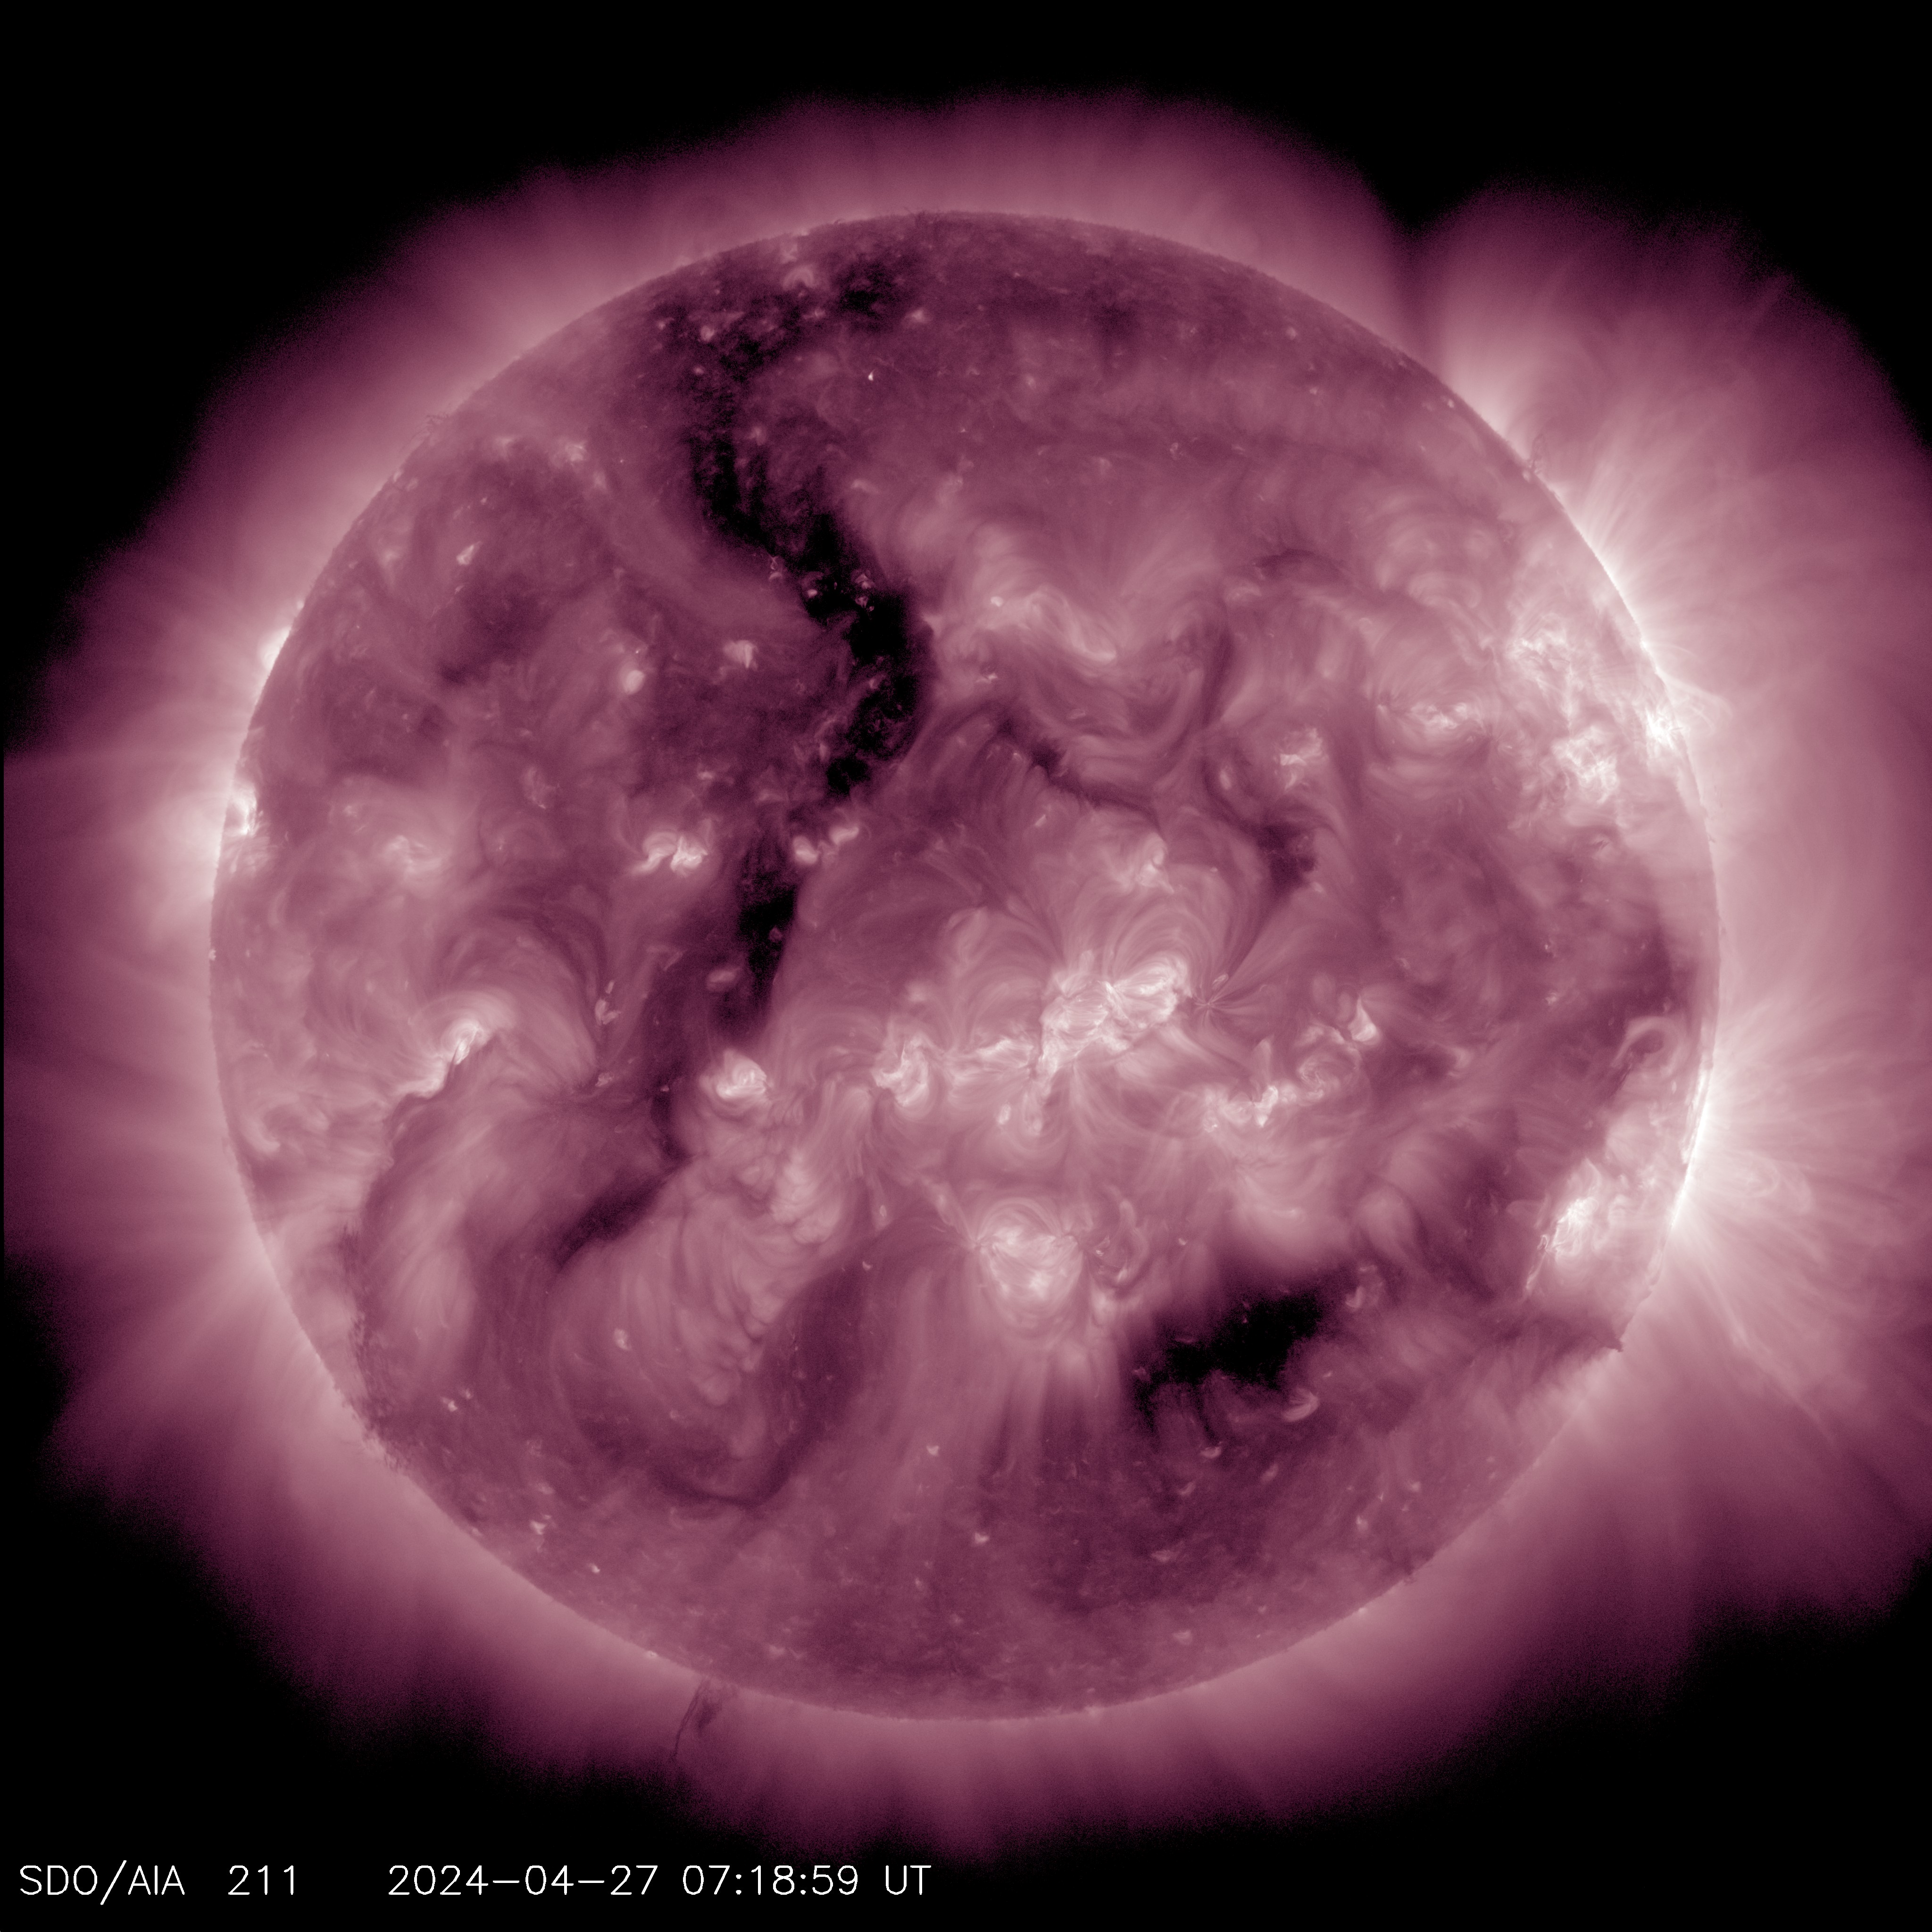
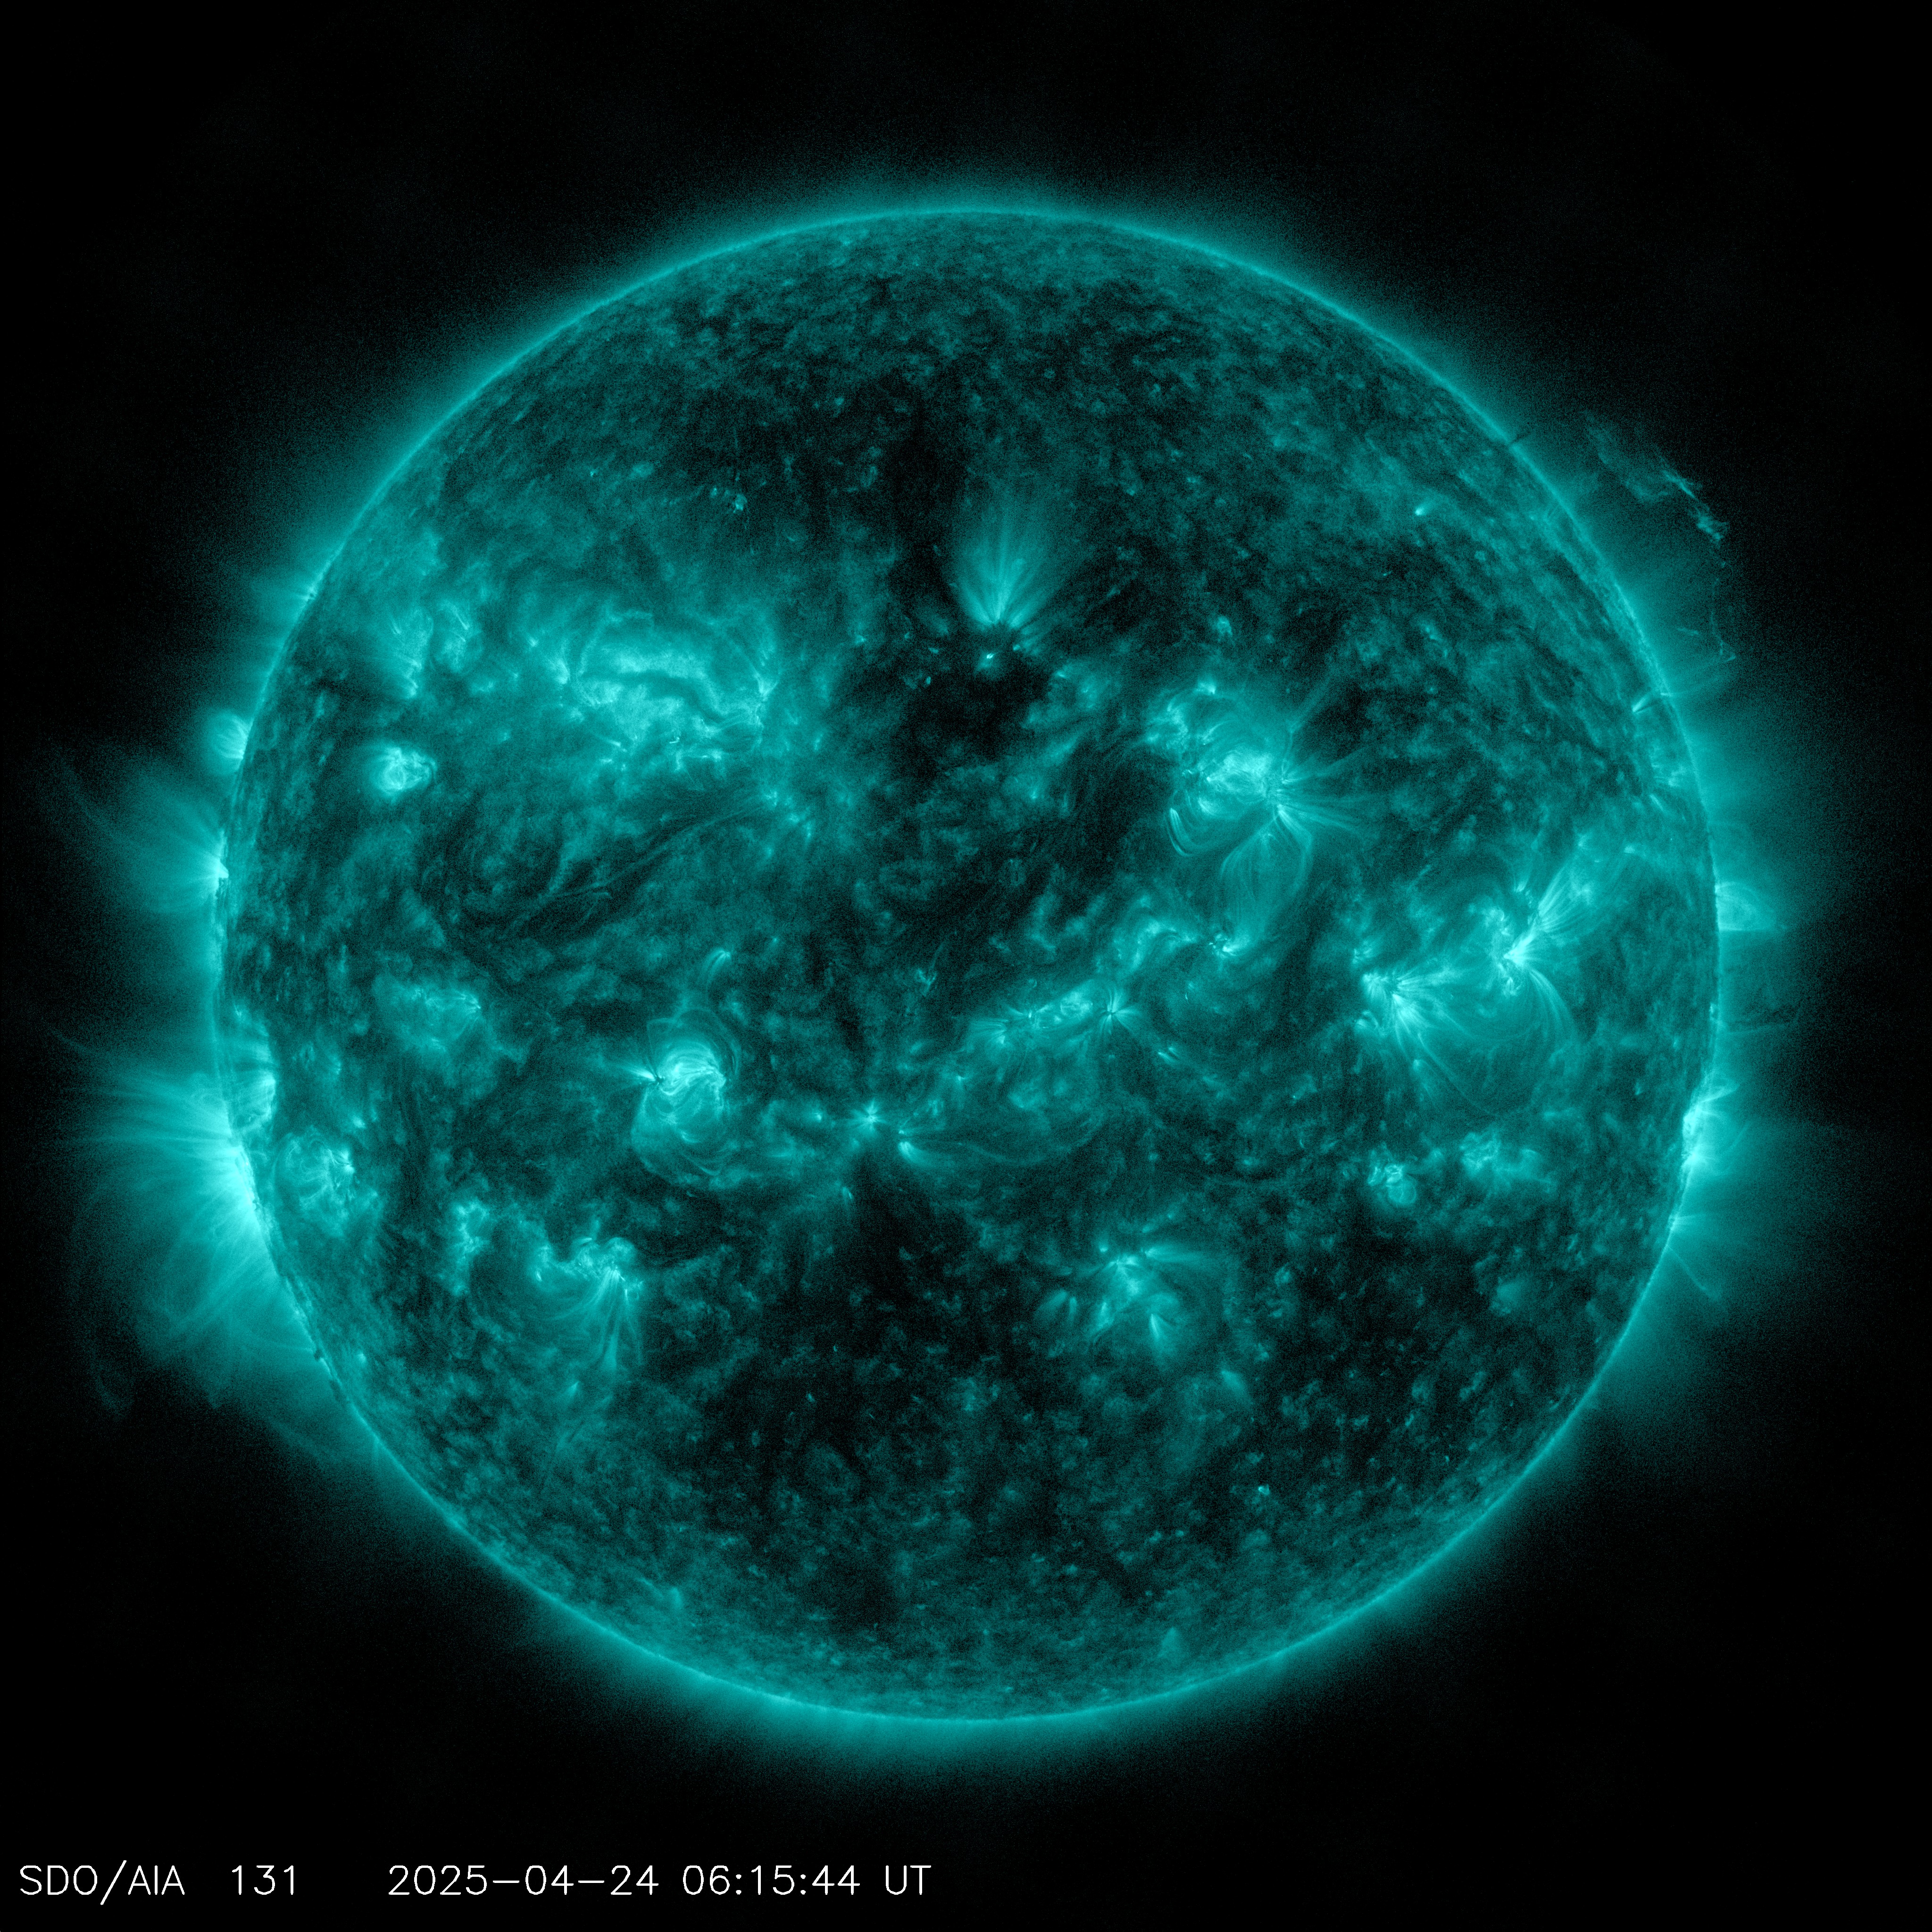
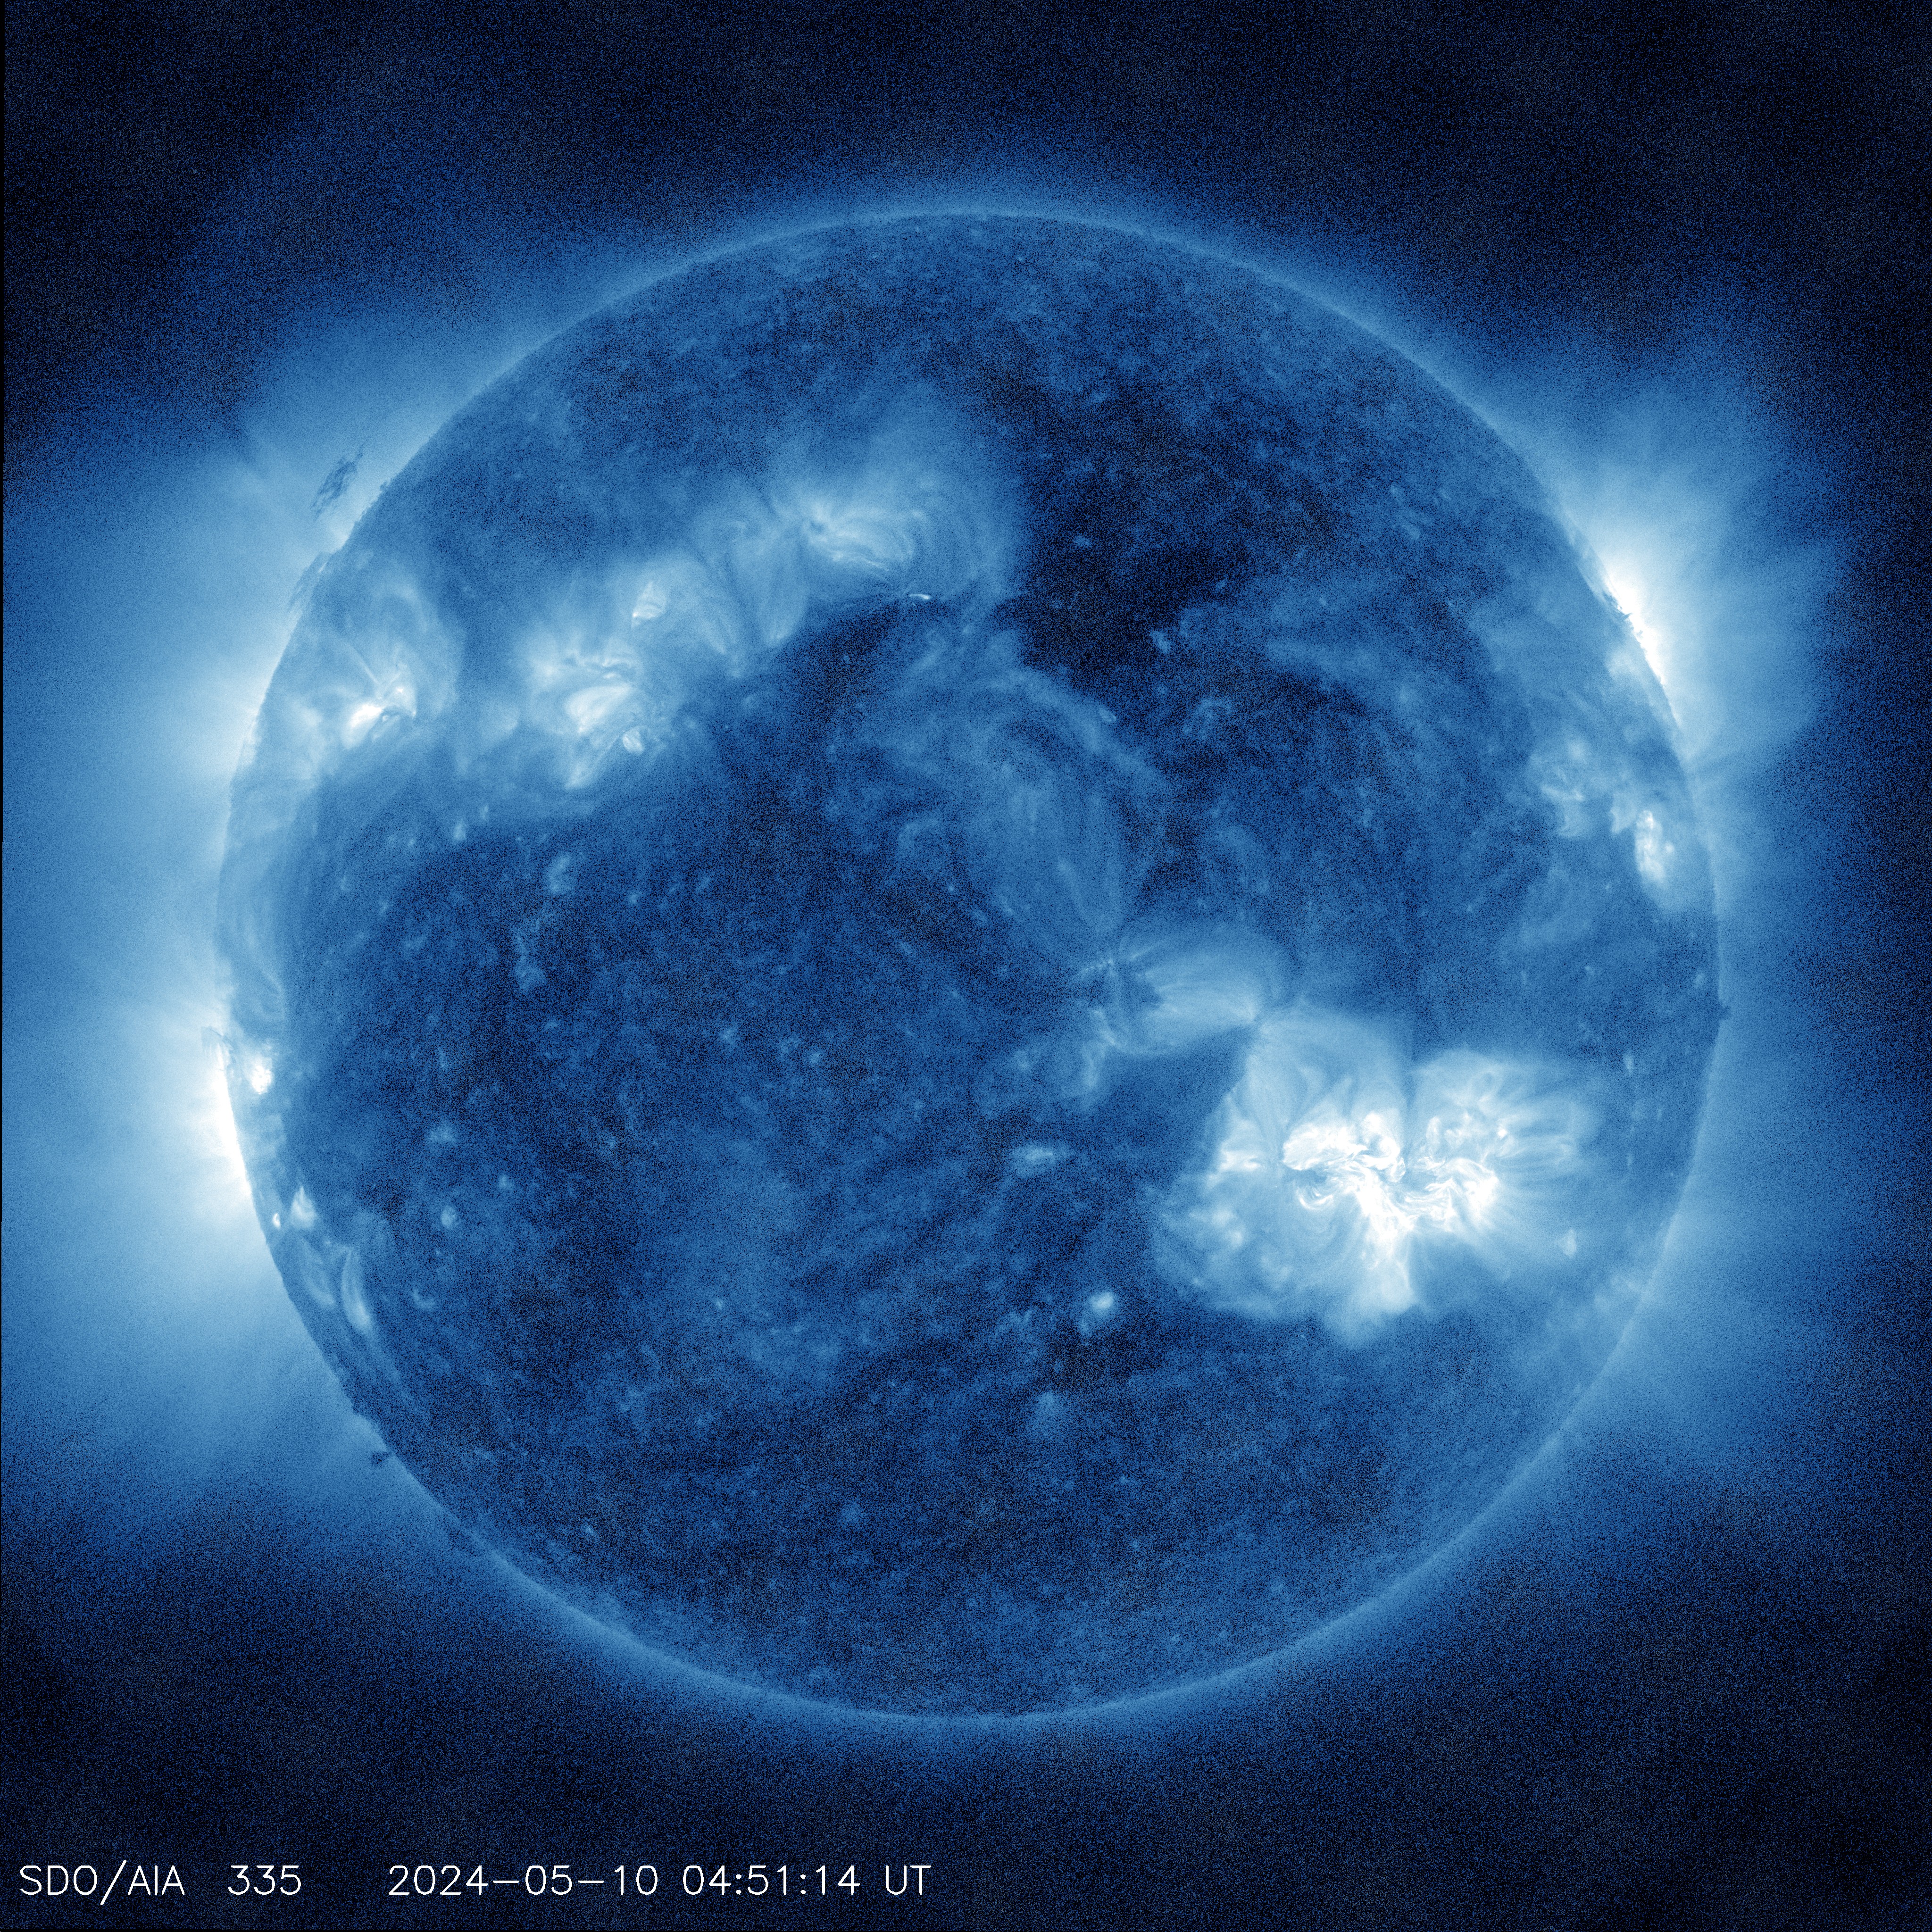
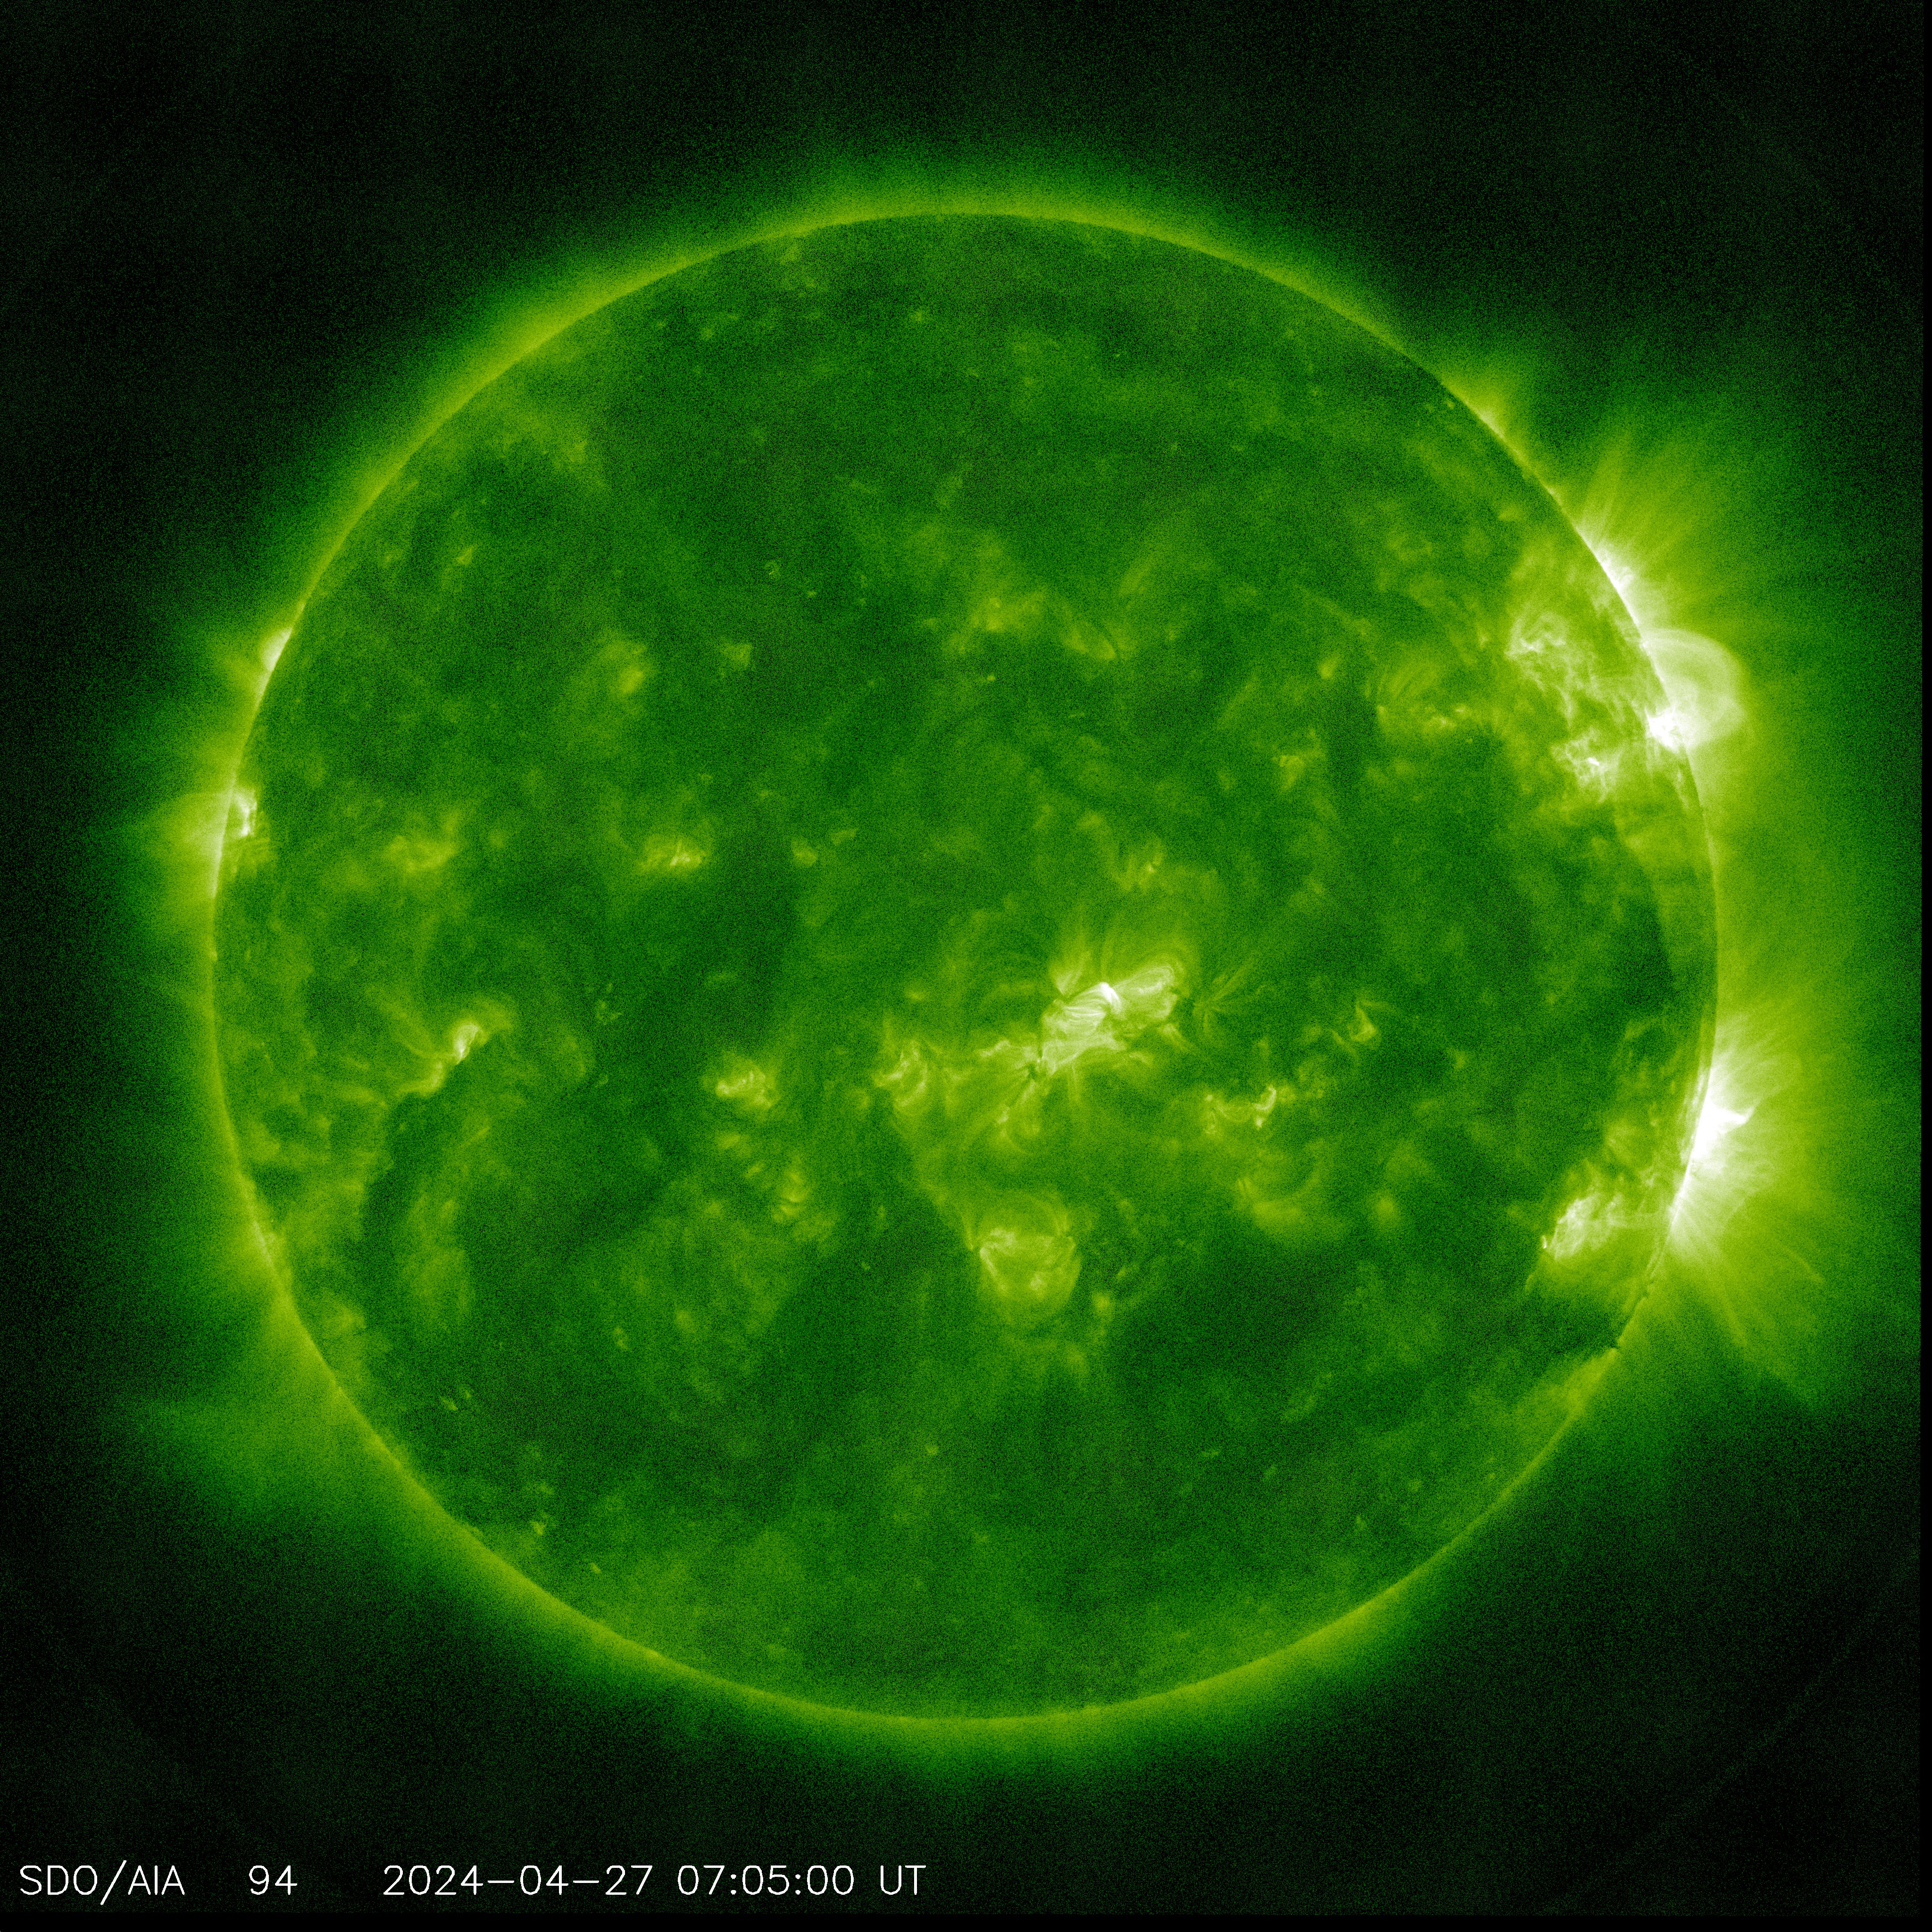
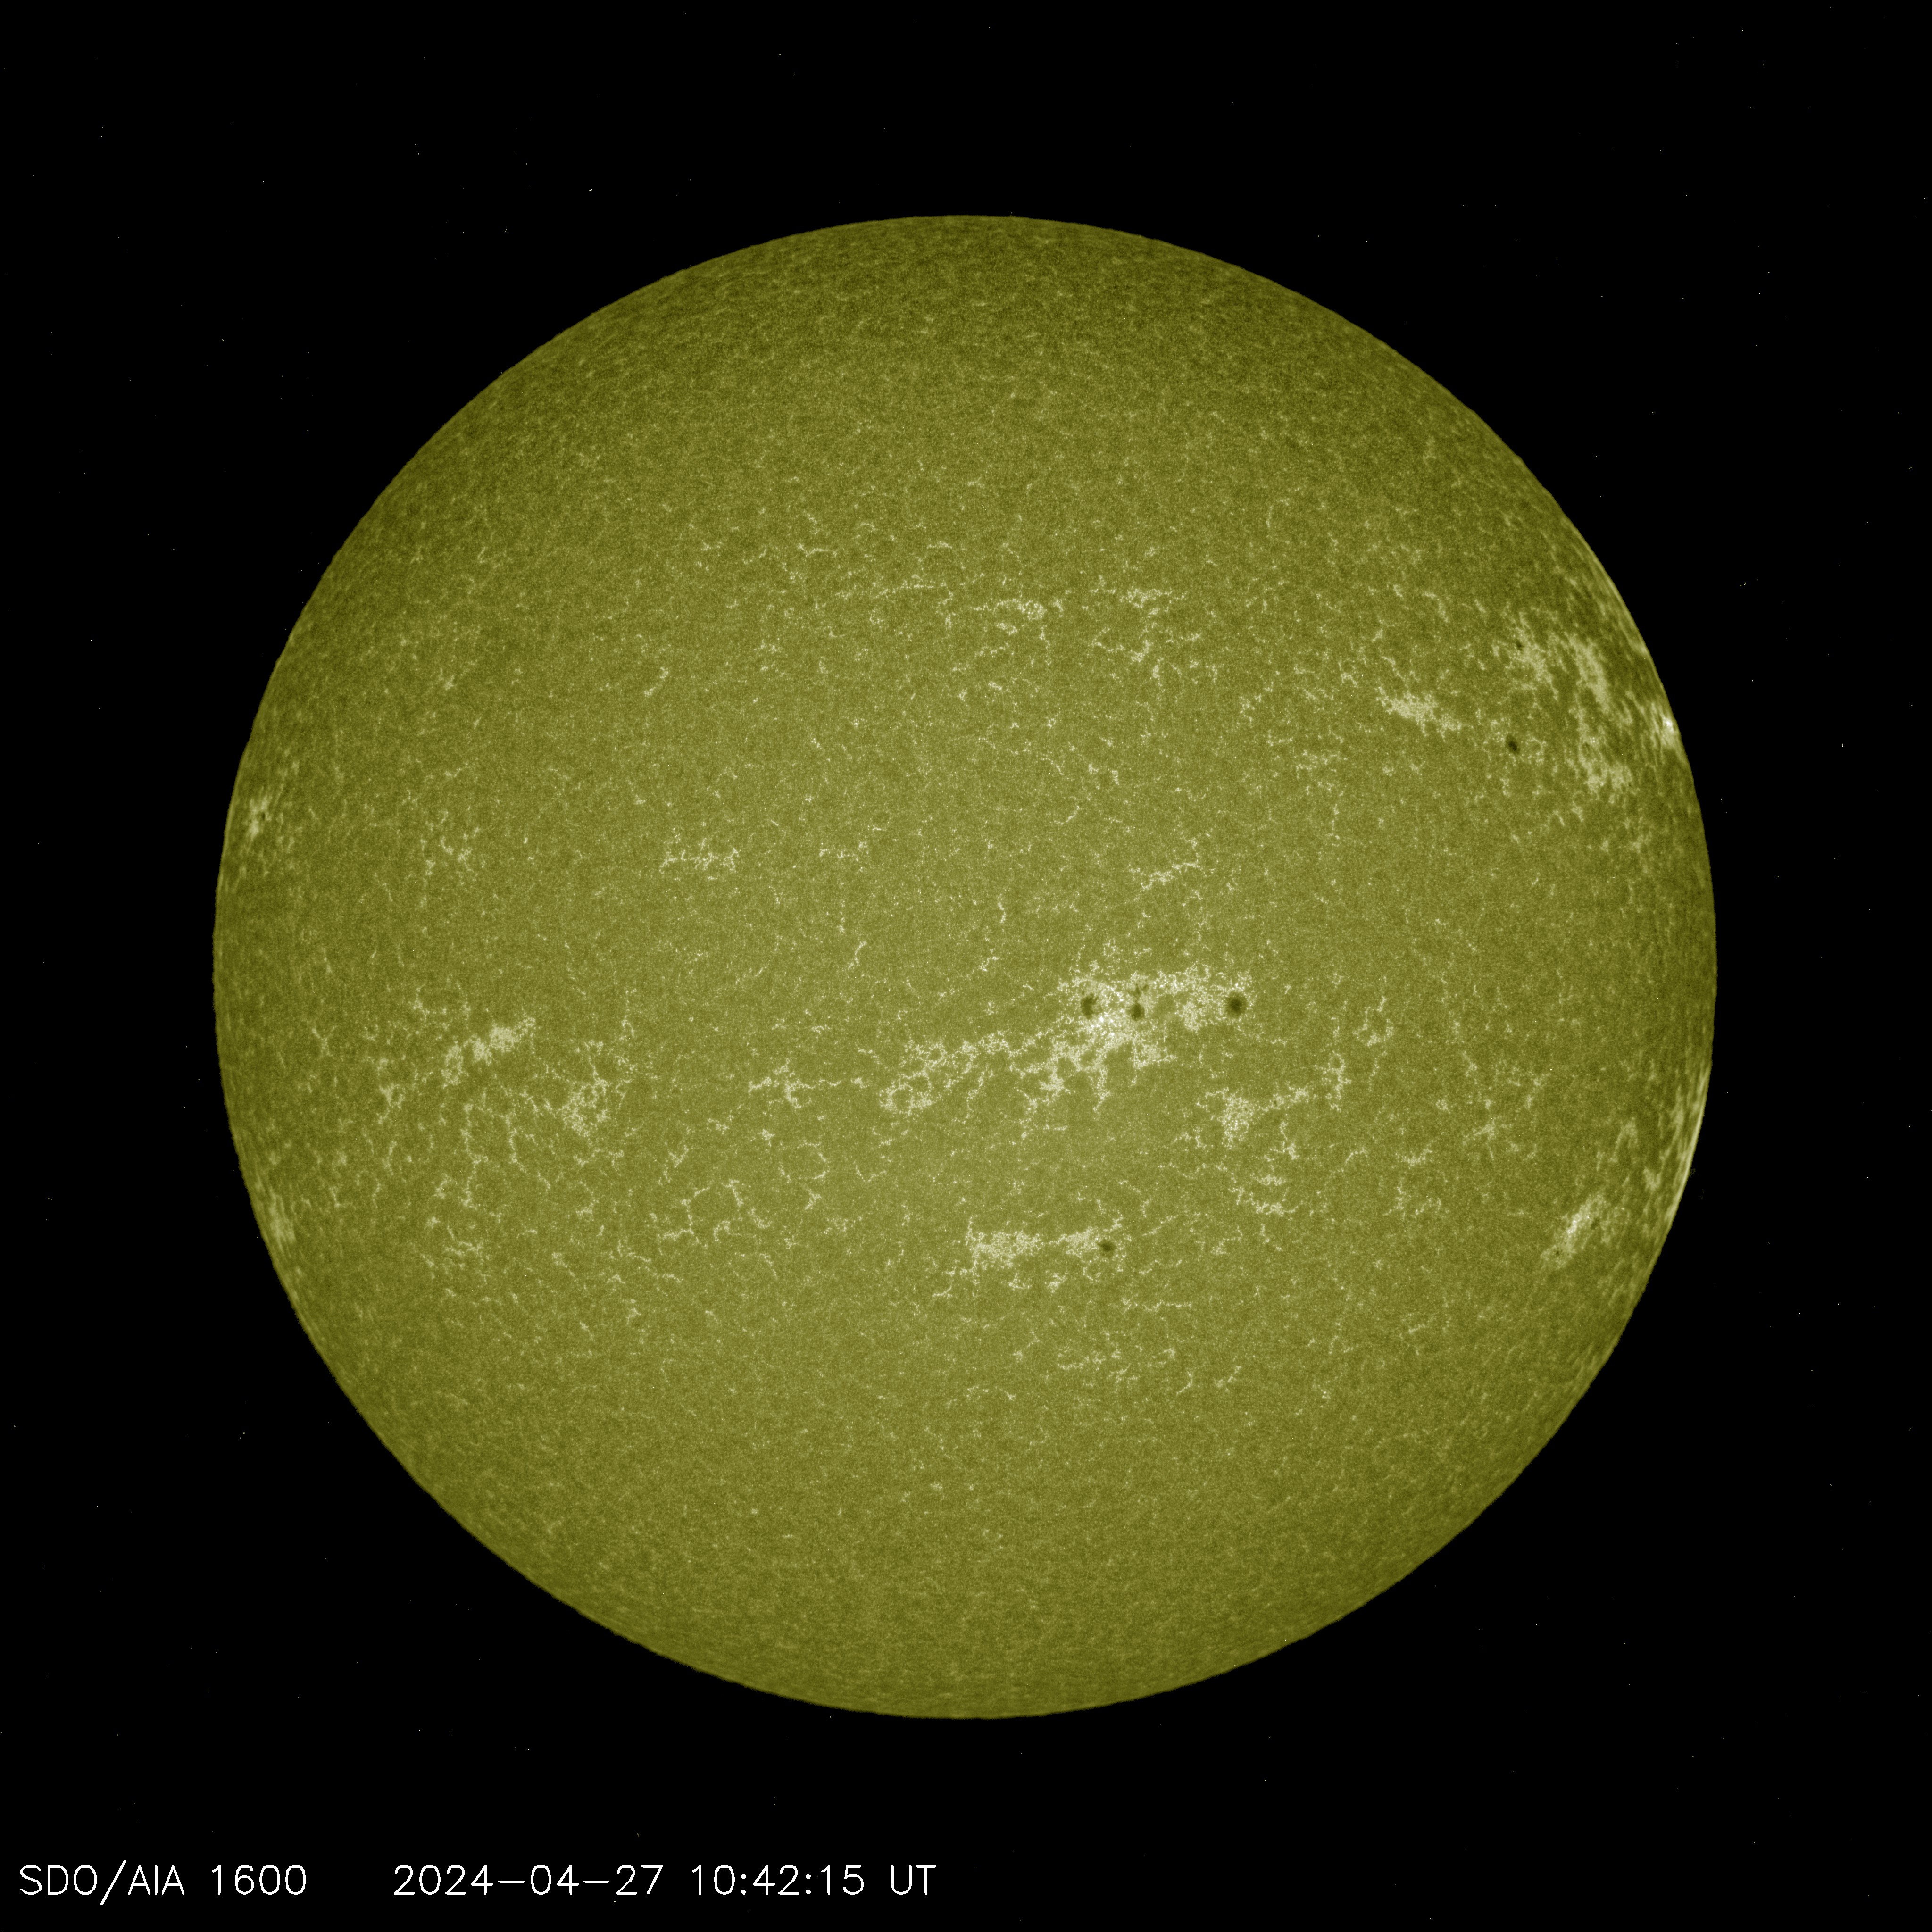
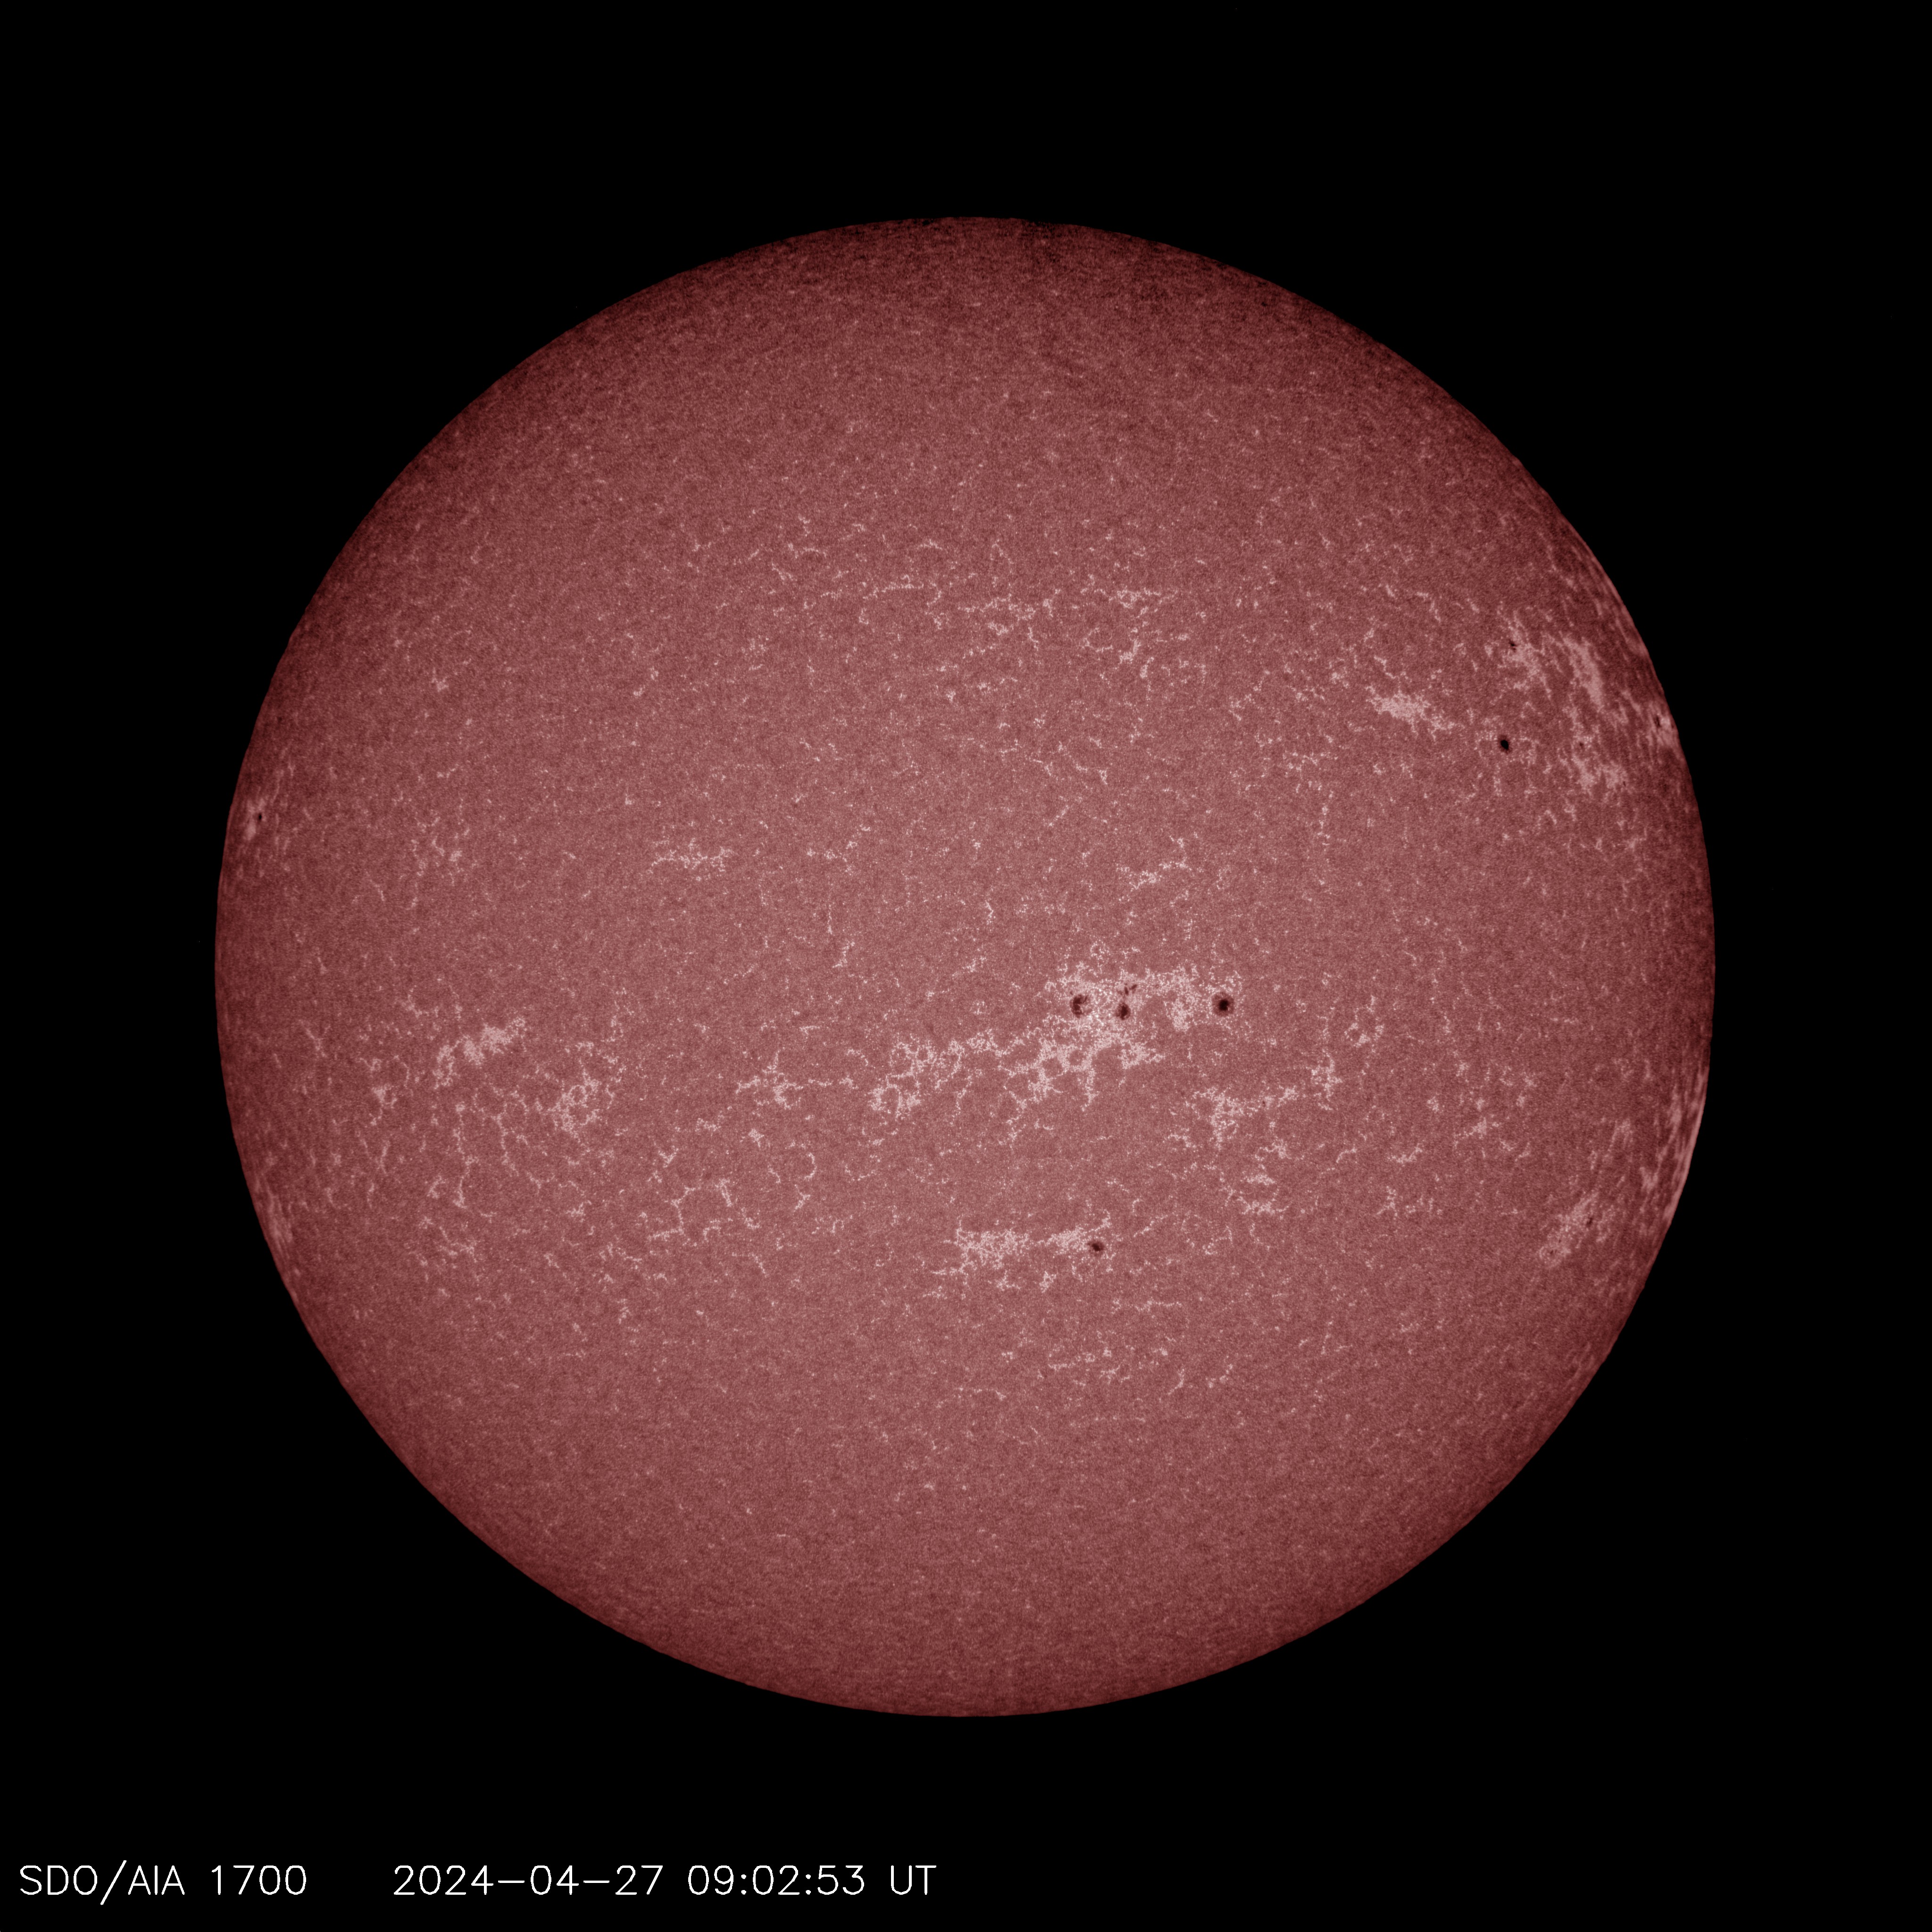
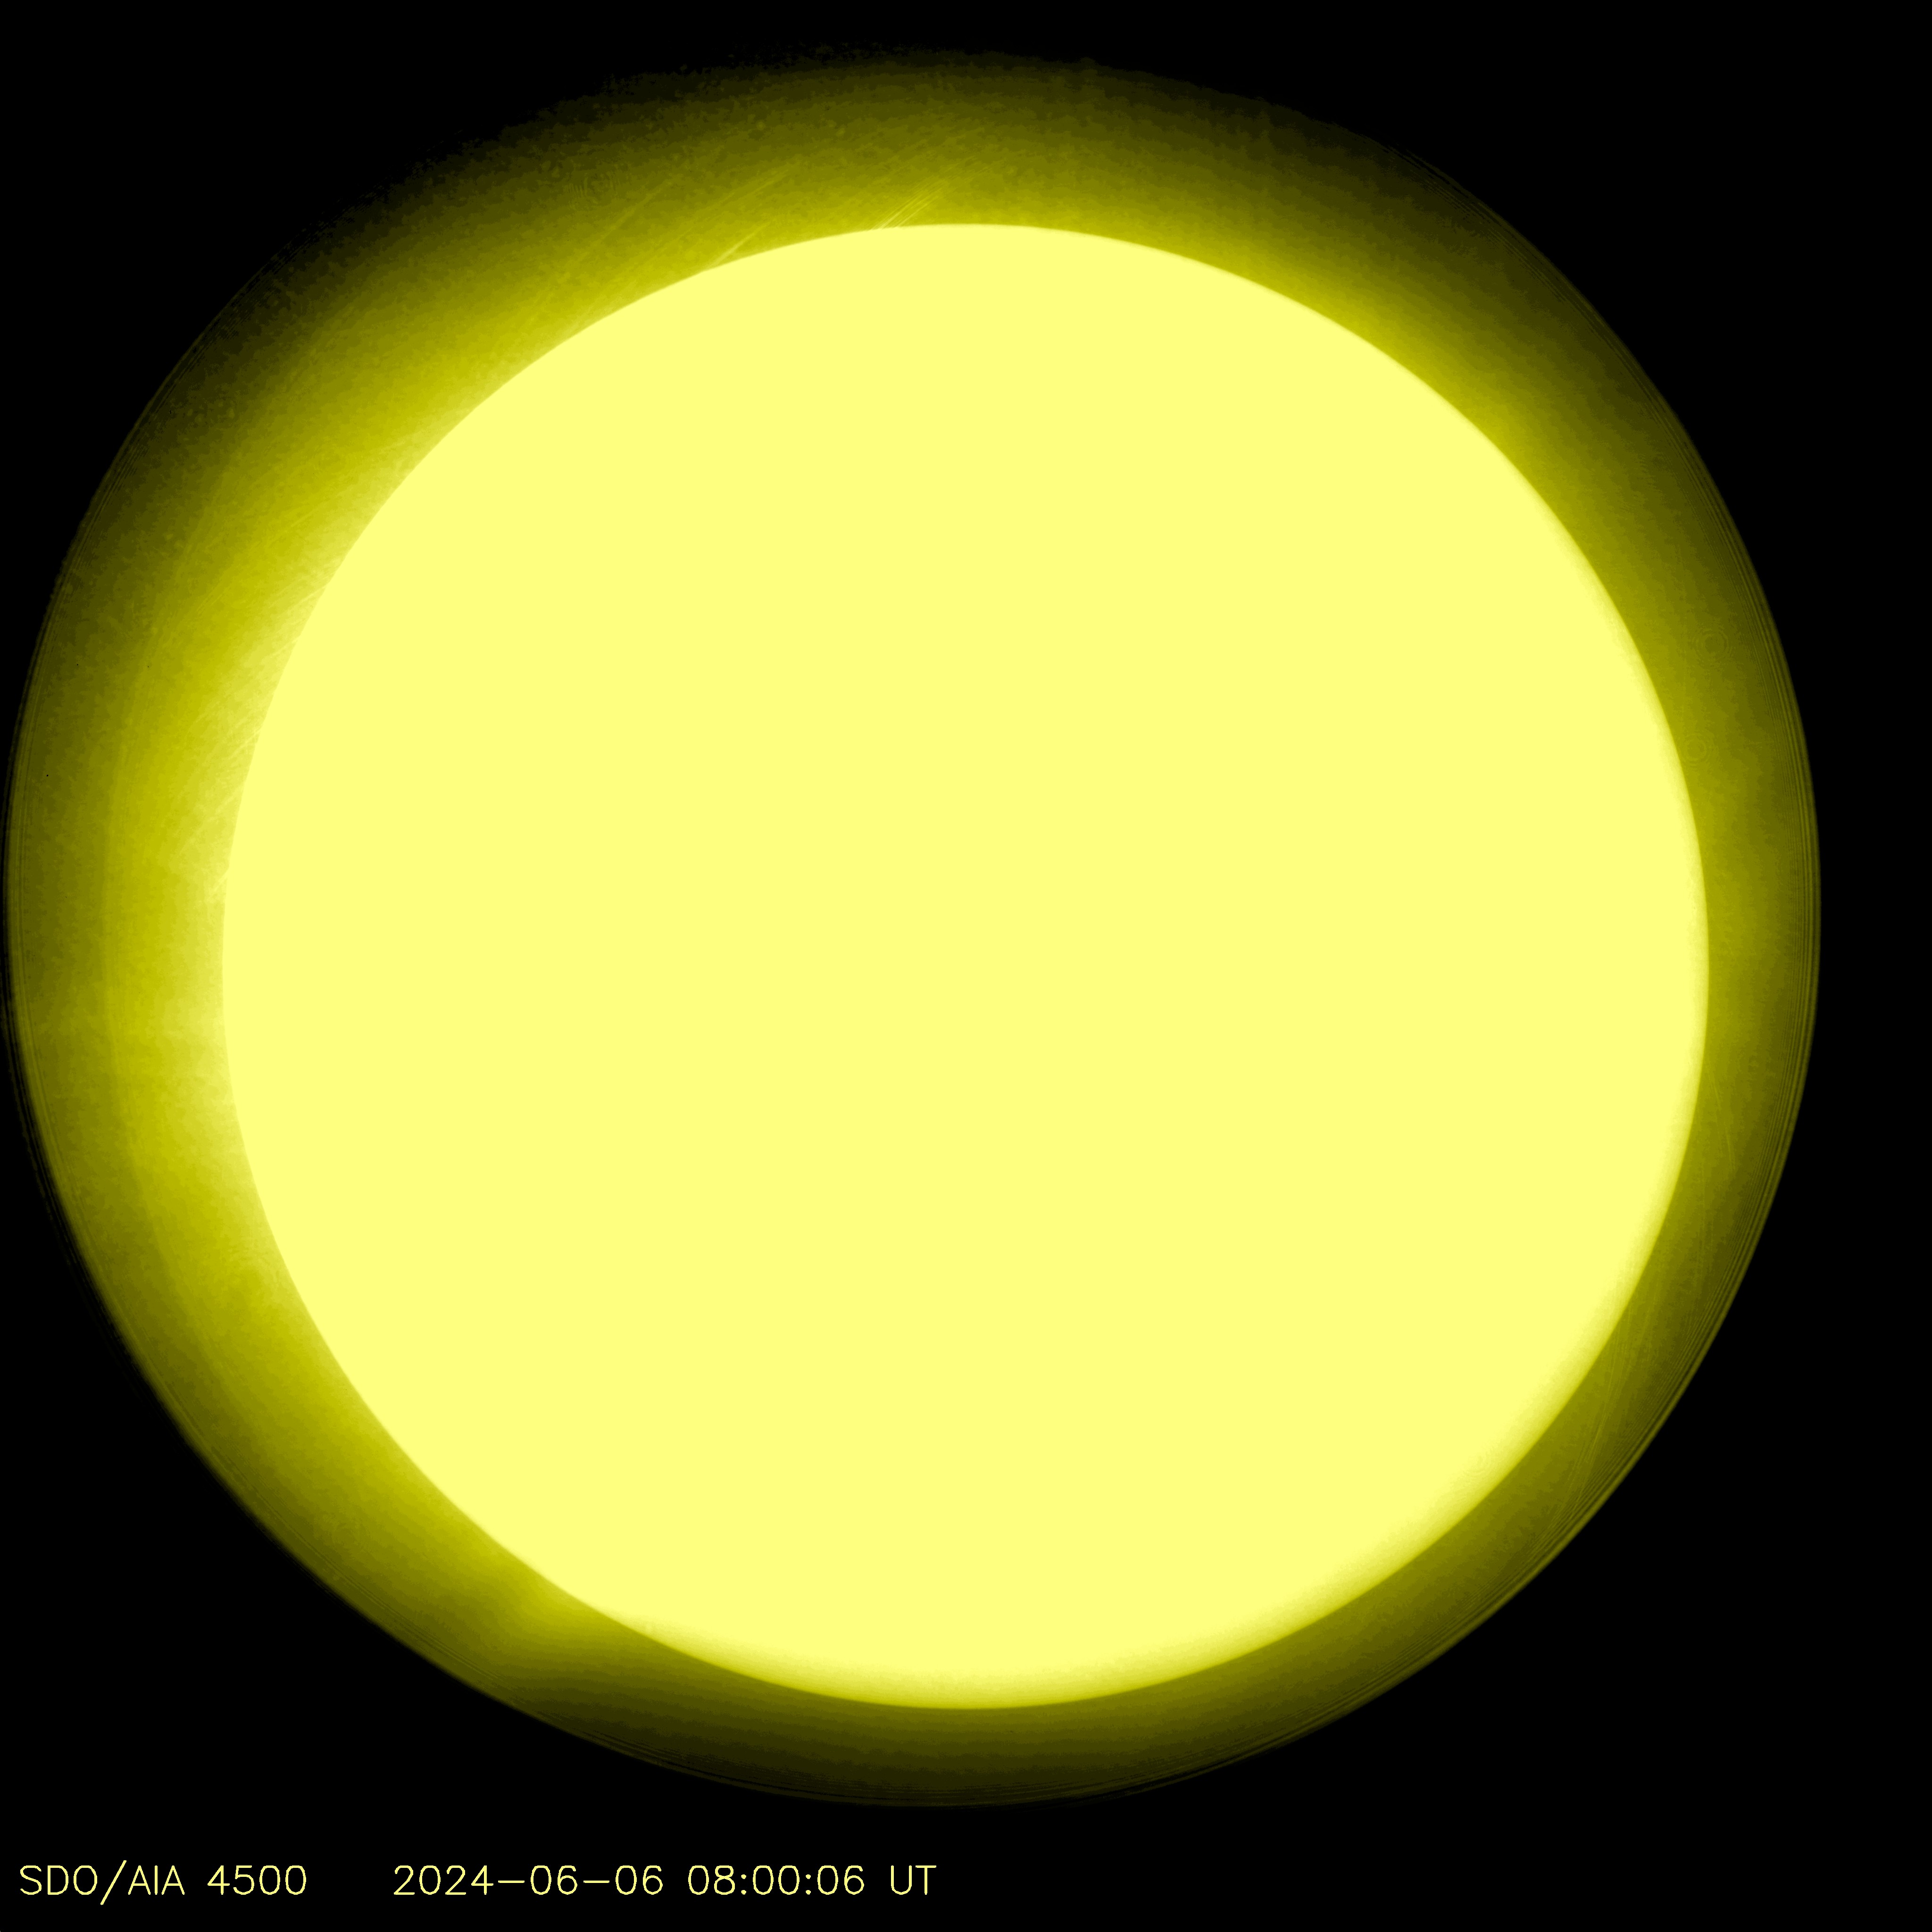
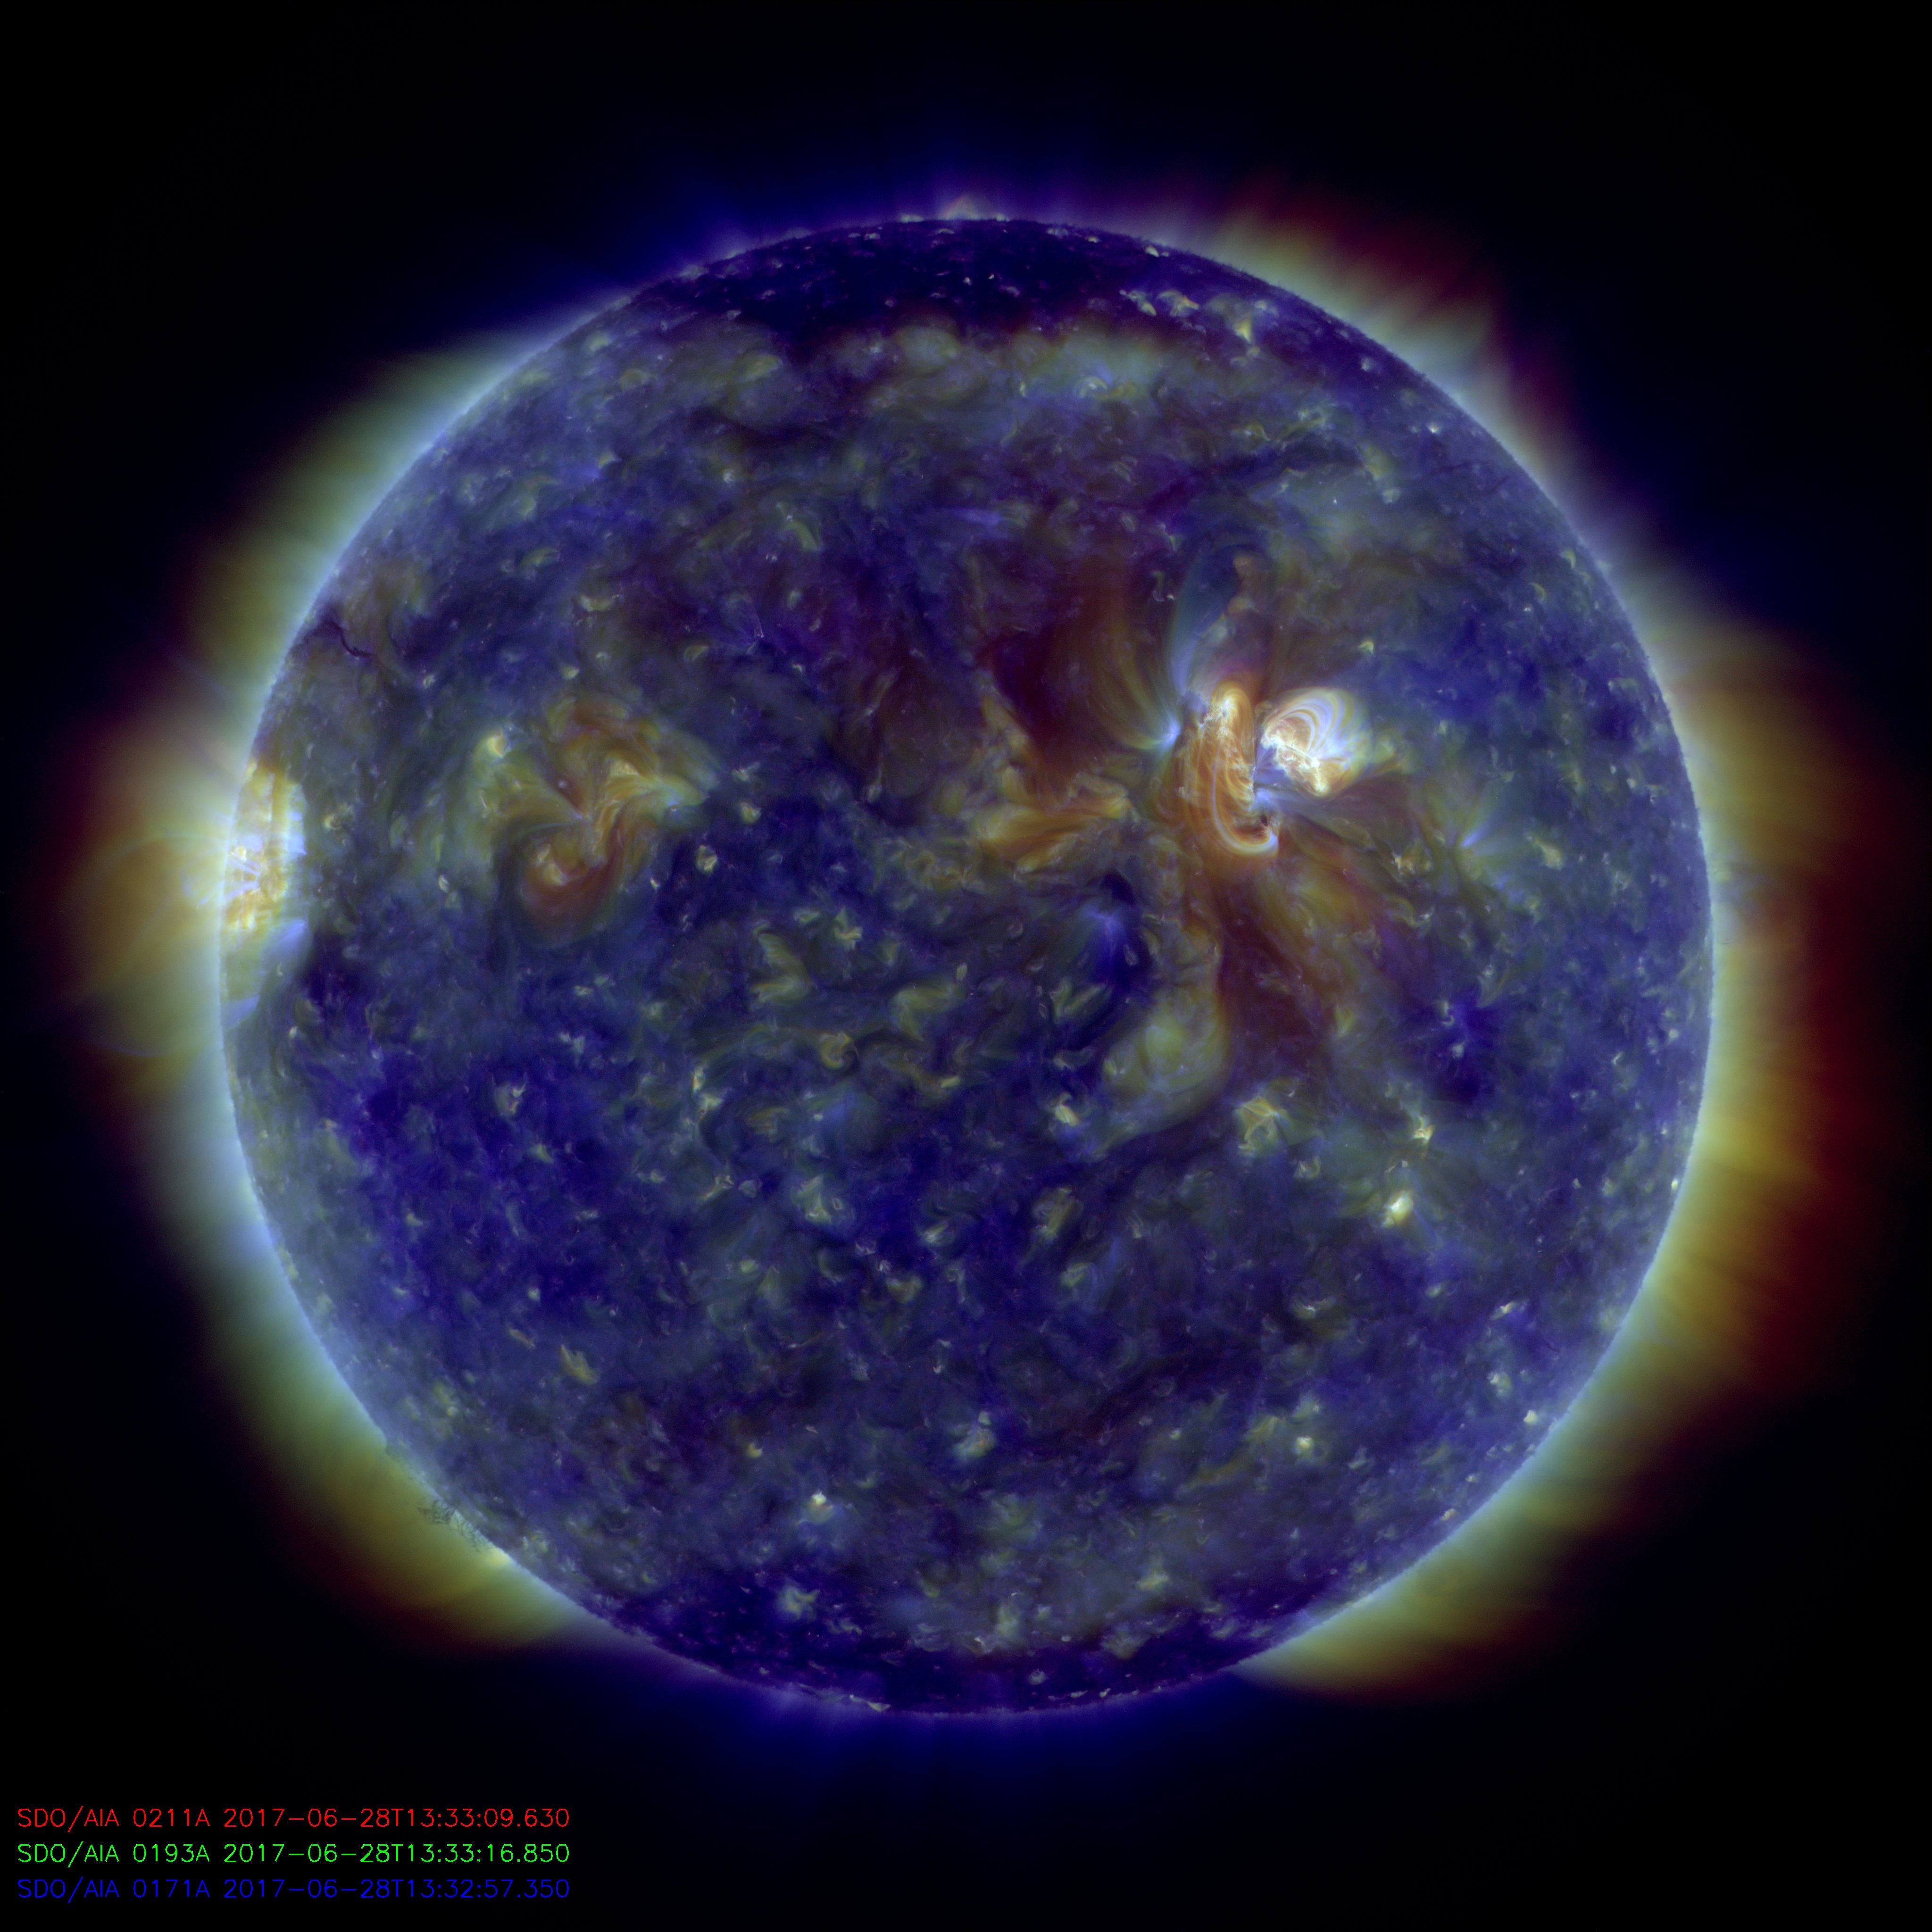
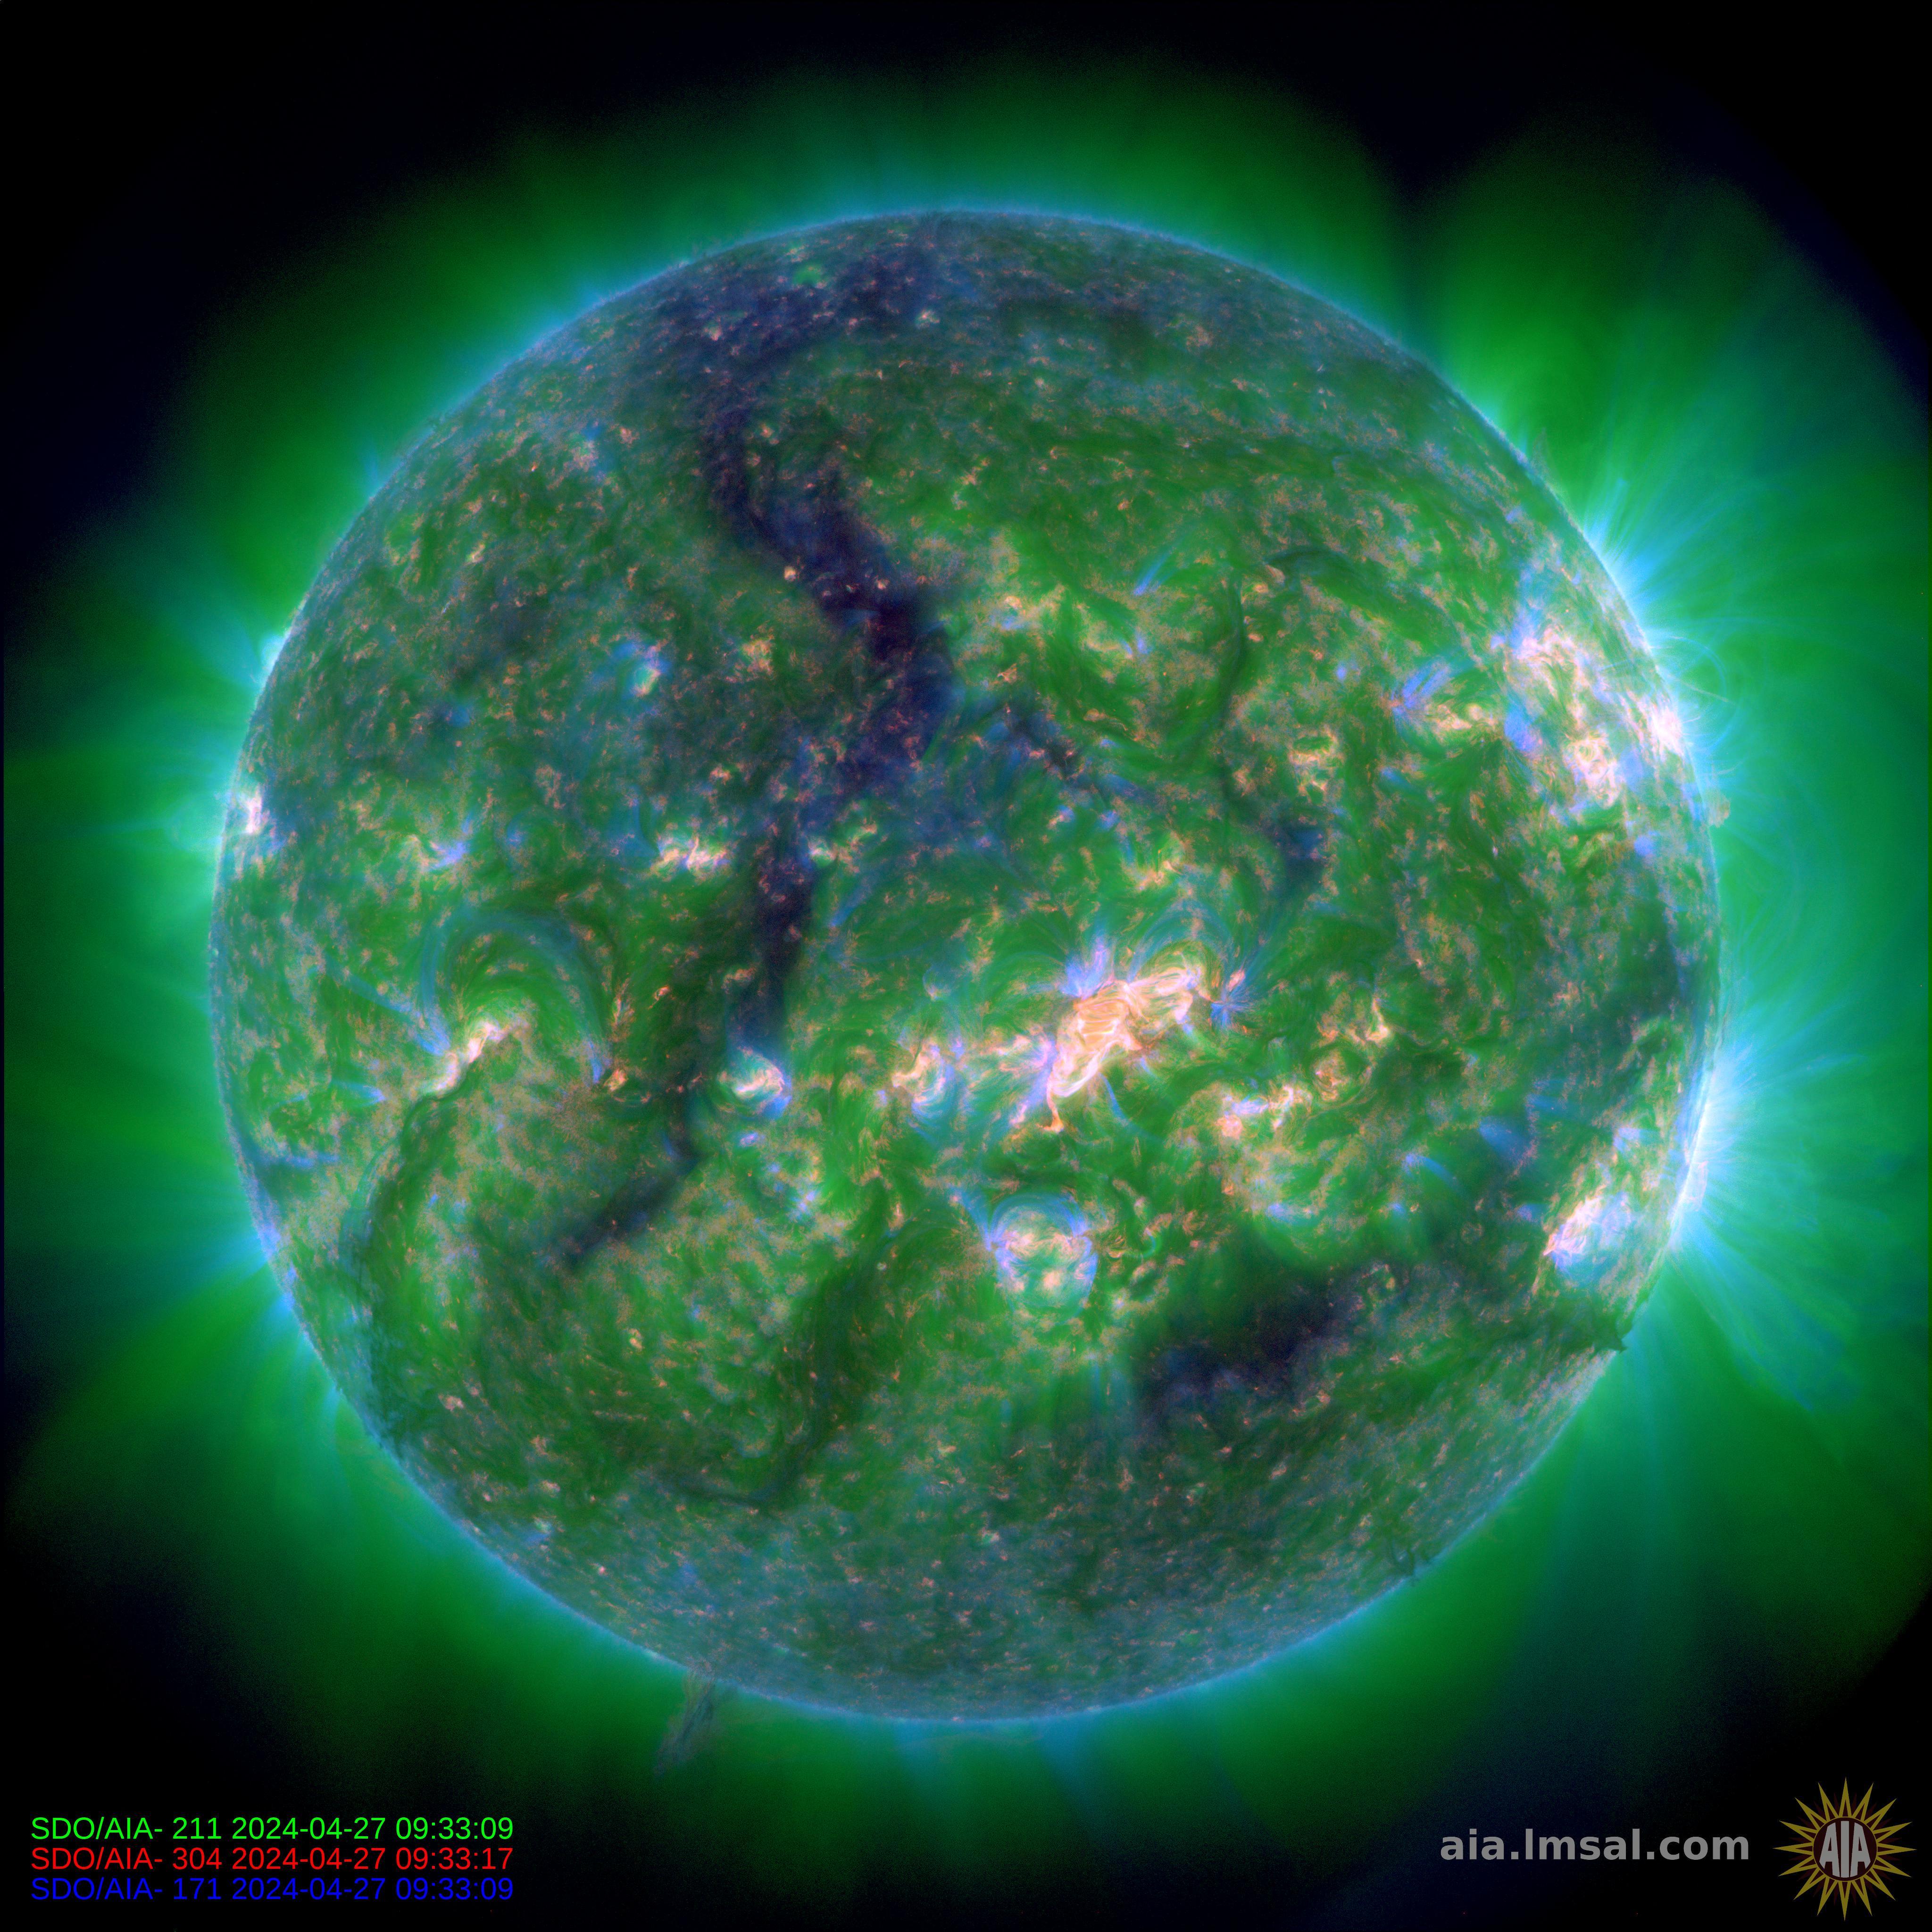
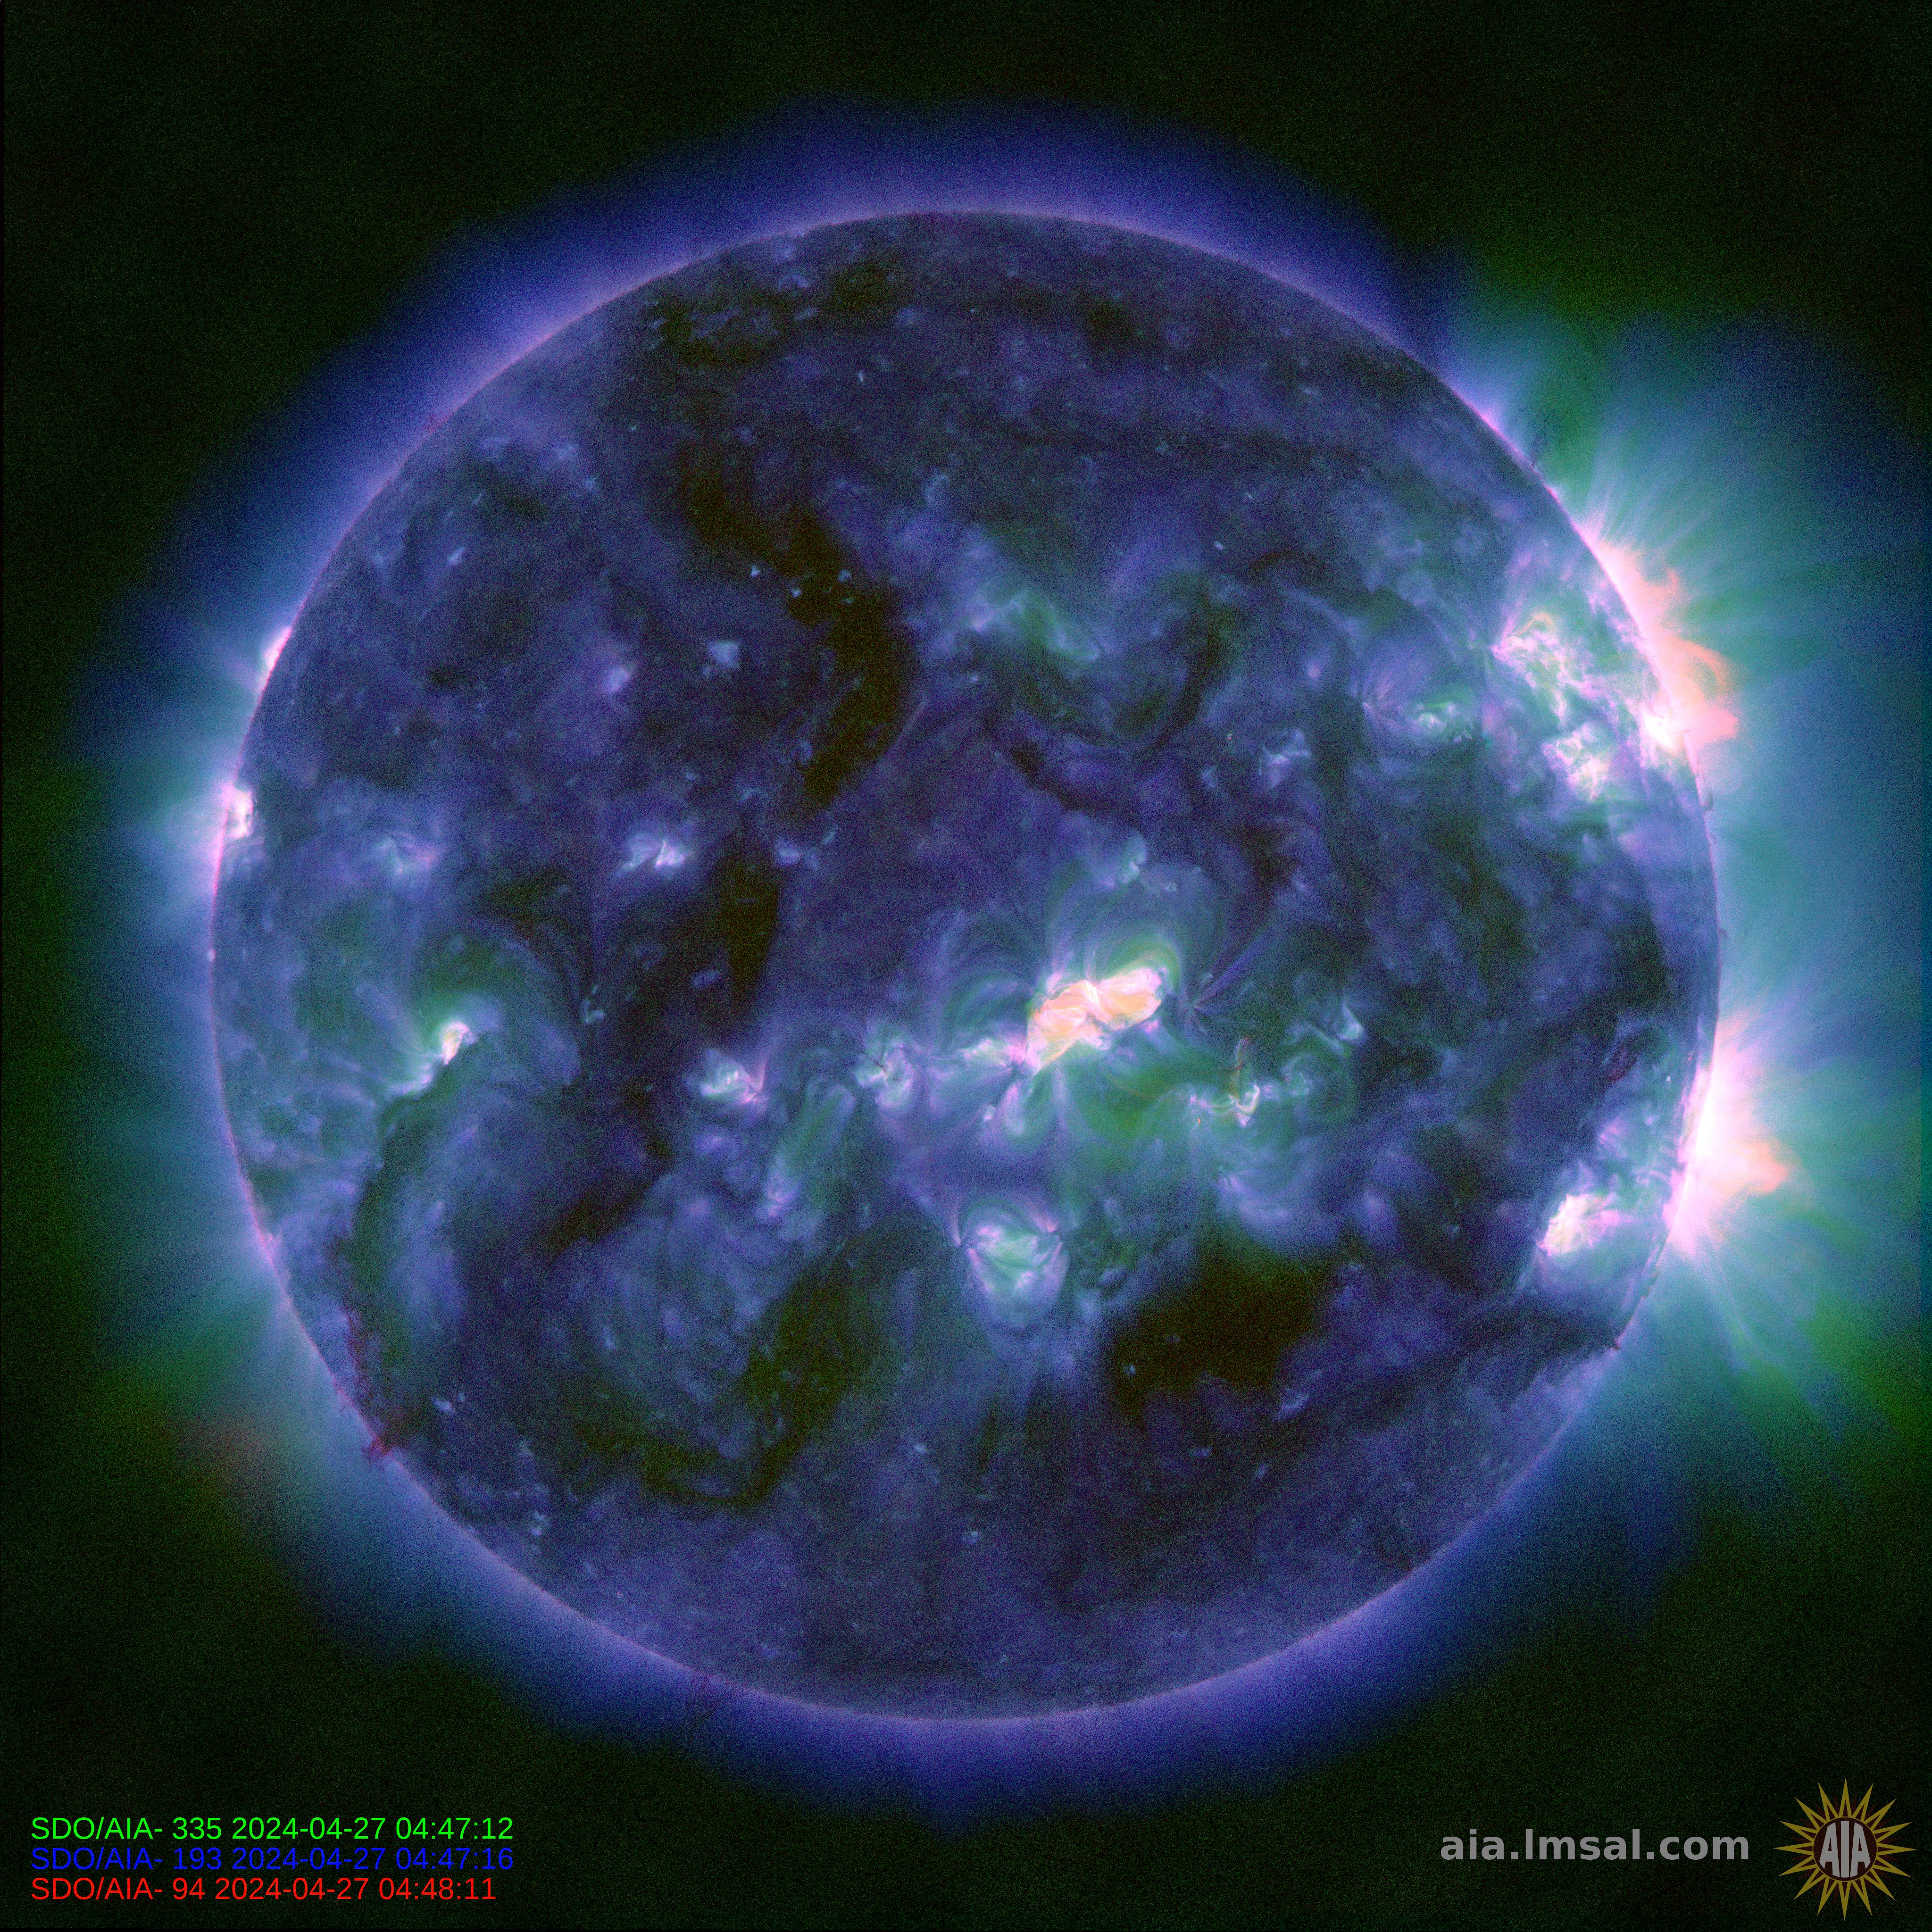
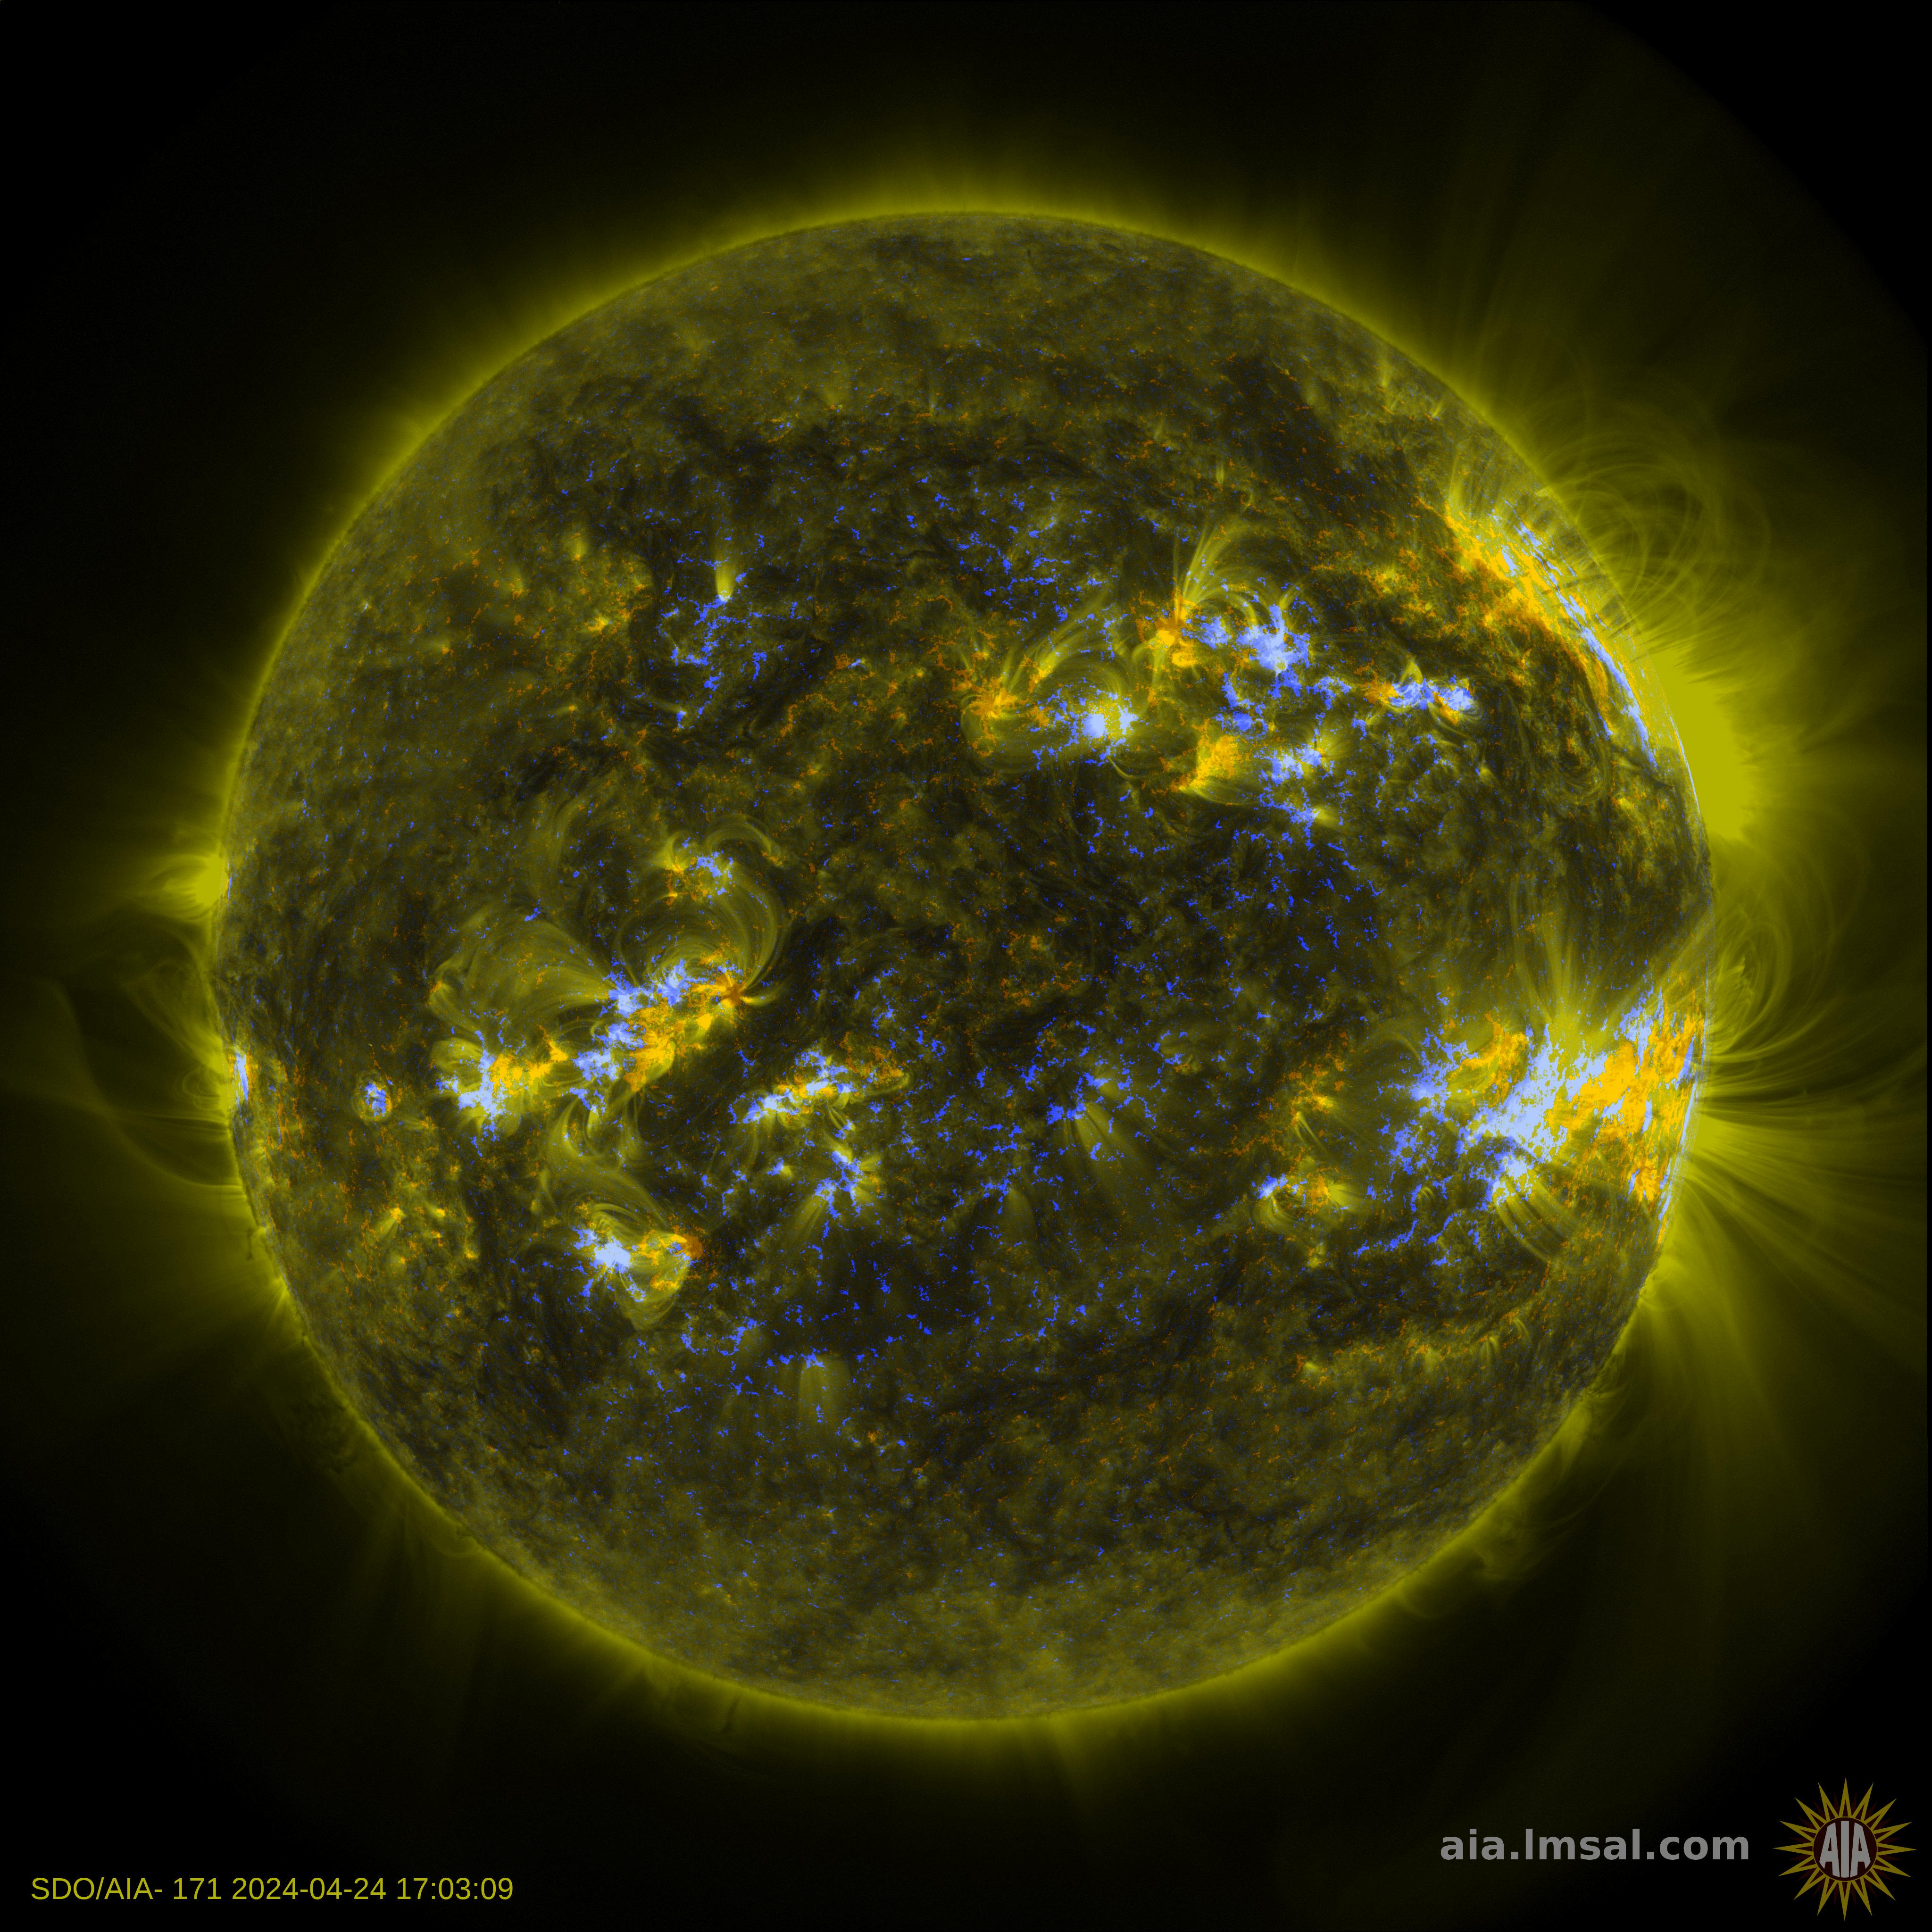
The images correspond to observations at different wavelengths, each emphasizing different regions and temperatures of the solar atmosphere:
- 9.4 nm (94 Å): This highlights regions of the corona during a solar flare.
- 13.1 nm (131 Å): Sensitive to very hot plasma during solar flares, while also containing contributions from cooler coronal plasma.
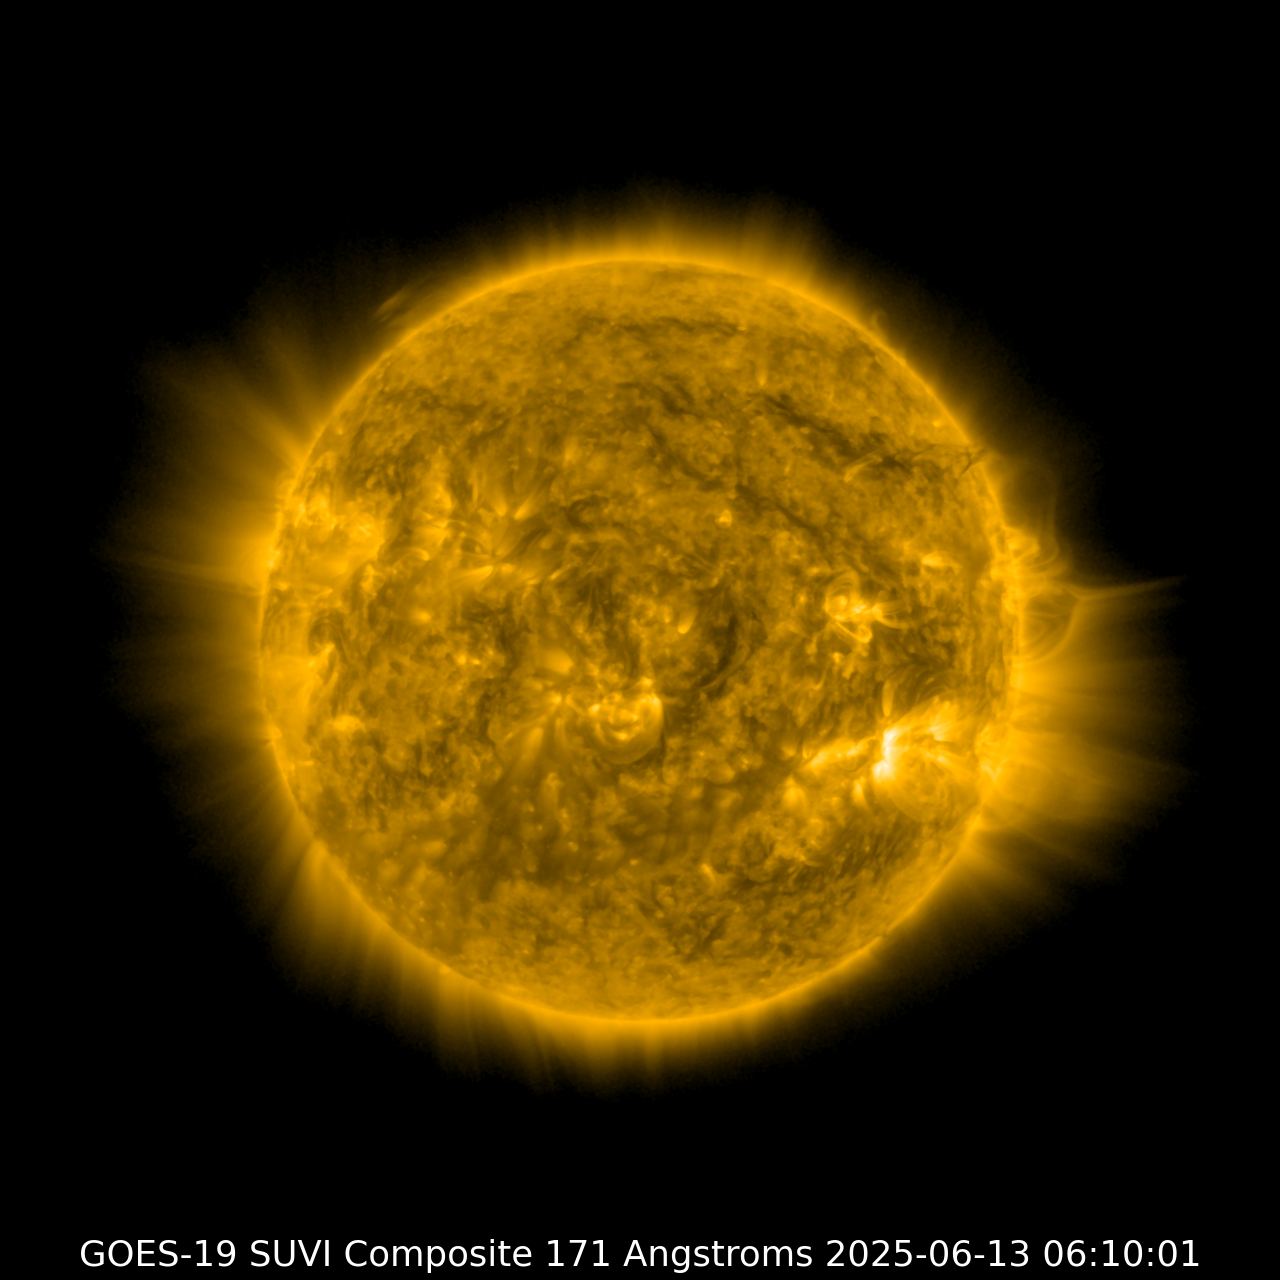
- 17.1 nm (171 Å): This wavelength shows the sun's atmosphere, or corona, when it's quiet. It also shows giant magnetic arcs known as coronal loops.
- 19.3 nm (193 Å): Shows a slightly hotter region of the corona, and also the much hotter material of a solar flare.
- 21.1 nm (211 Å): This wavelength shows hotter, magnetically active regions in the sun's corona.
- 30.4 nm (304 Å): Dominated by emission from singly ionized helium (He II), showing plasma in the chromosphere and transition region.
- 33.5 nm (335 Å): This wavelength also shows hotter, magnetically active regions in the corona.
- 160 nm (1600 Å): Shows a mixture between the upper photosphere and what's called the transition region, a region between the chromosphere and the upper most layer of the sun's atmosphere called the corona. The transition region is where the temperature rapidly rises.
- 170 nm (1700 Å): Shows the surface of the sun, as well as a layer of the sun's atmosphere called the chromosphere, which lies just above the photosphere and is where the temperature begins rising.
- 450 nm (4500 Å): Visible-light continuum showing the solar photosphere.
SOHO EIT
Pictures of the Sun taken by SOHO's Extreme Ultraviolet Imaging Telescope (EIT). This instrument images the solar corona and transition region in four EUV bandpasses (171 Å, 195 Å, 284 Å, and 304 Å), which are wavelengths corresponding to plasma at different temperatures and ionization states. It allows for the monitoring of active regions, coronal holes, filaments and prominences, coronal bright points and polar plumes.
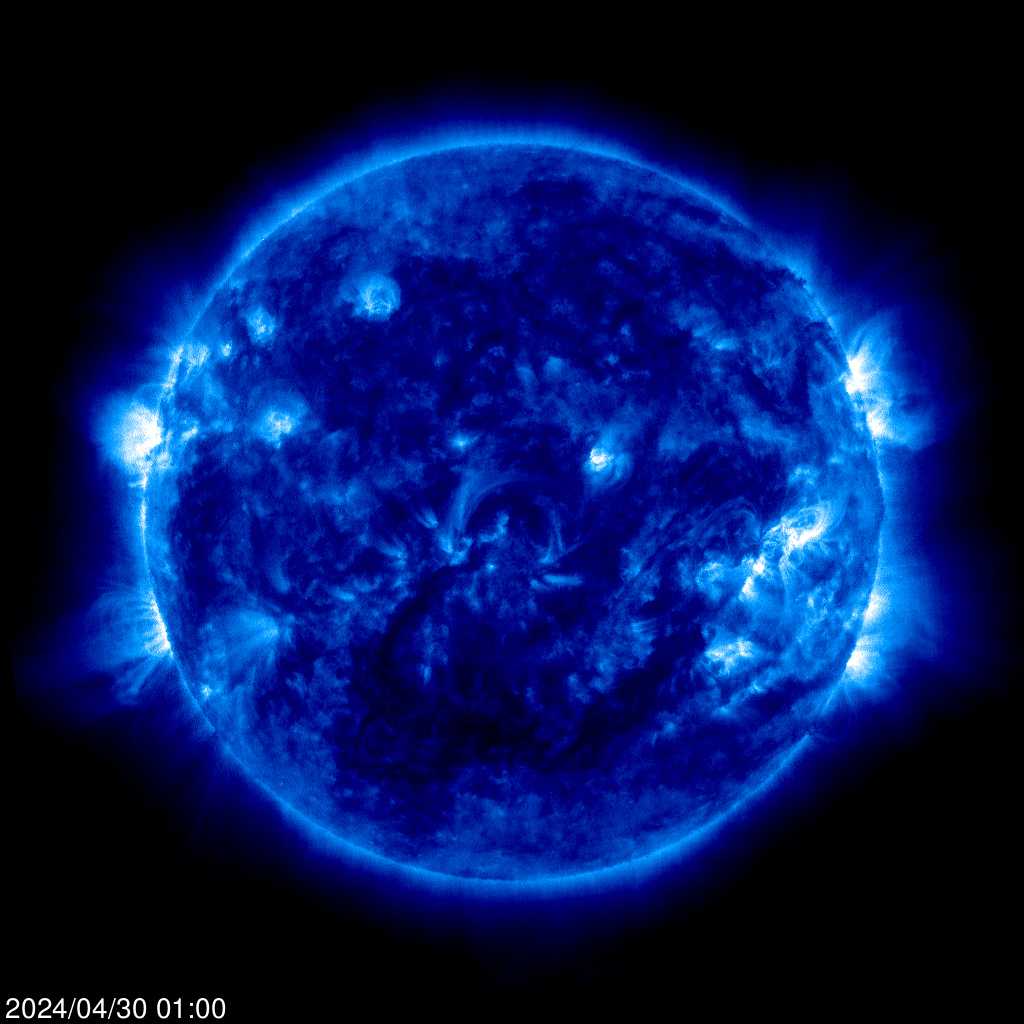
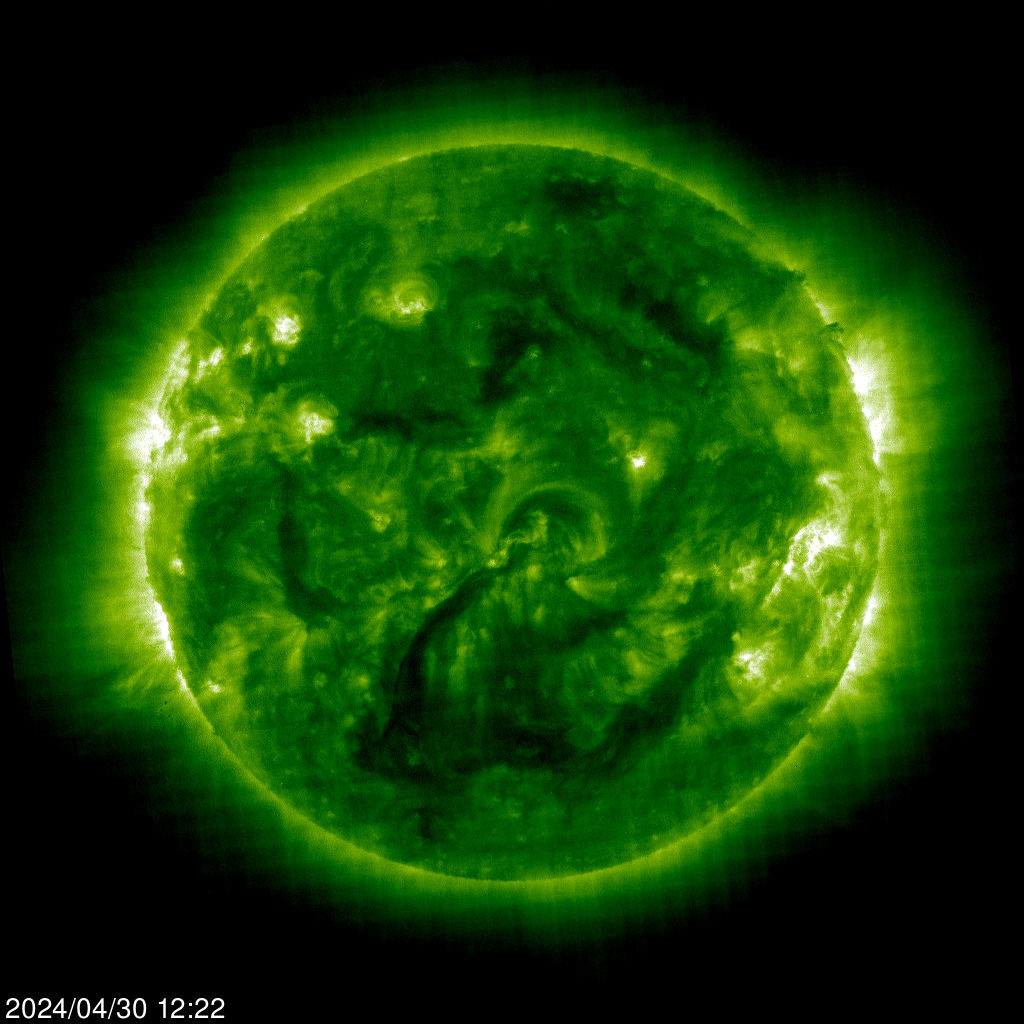
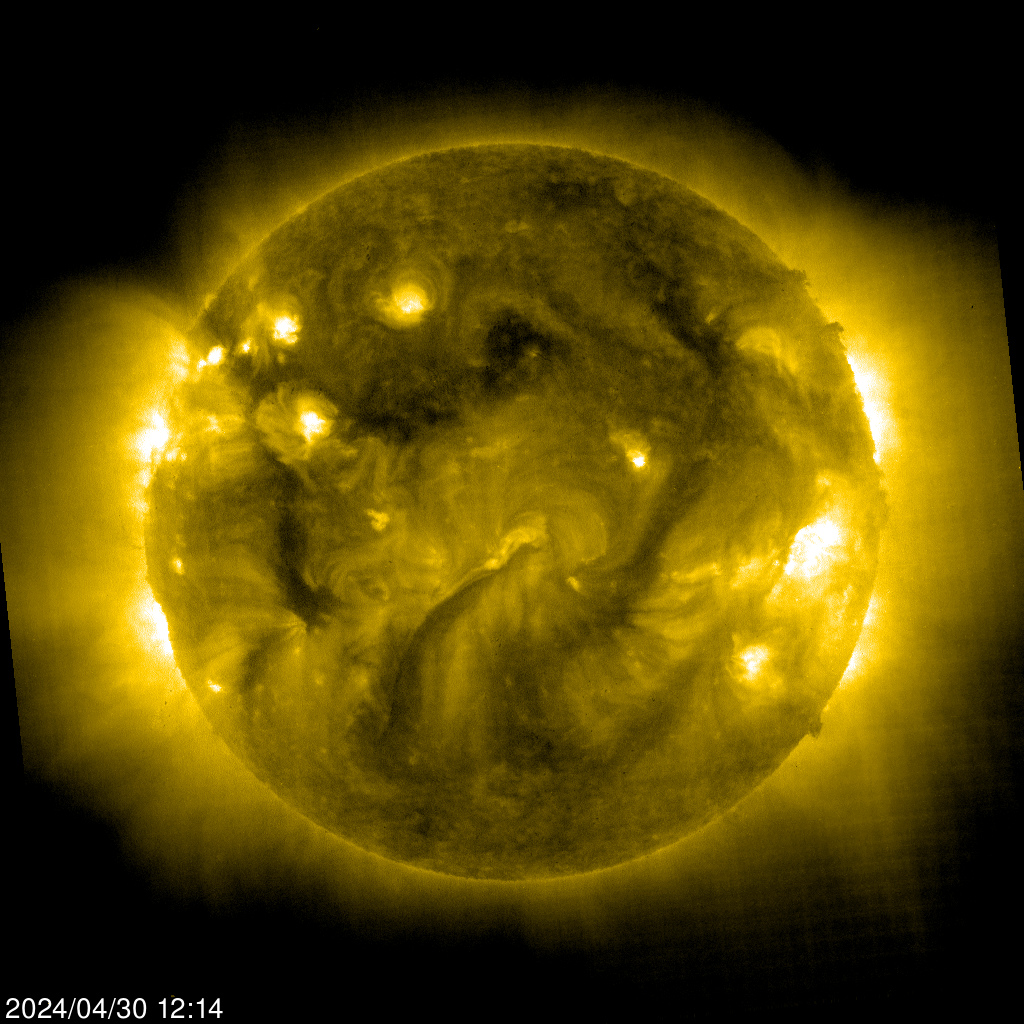
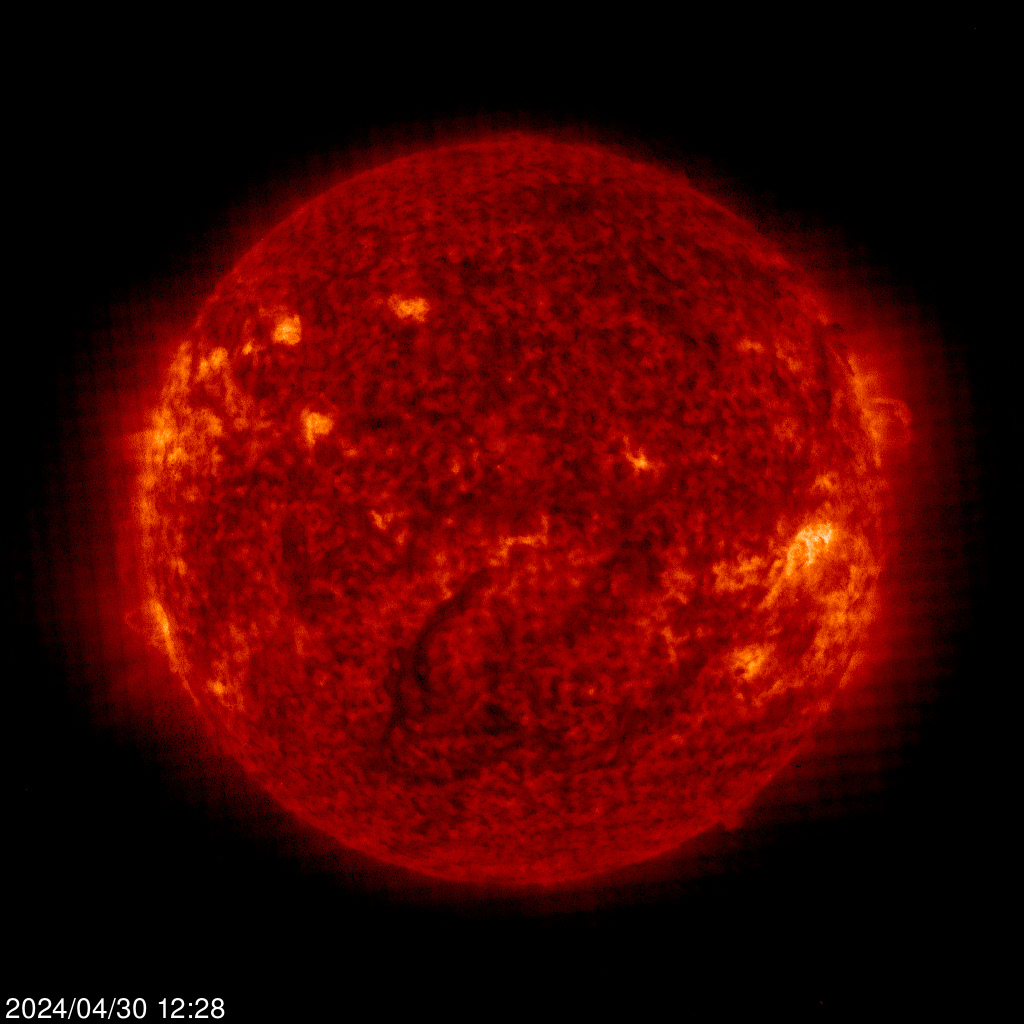
Current solar images acquired with the EIT (Extreme ultraviolet Imaging Telescope) instrument at different wavelengths:
- 17.1 nm: quiet corona, coronal loops, coronal holes.
- 19.5 nm: active-region corona, magnetic loop systems.
- 28.4 nm: hot active regions and strong coronal heating.
- 30.4 nm: chromosphere and transition region, prominences and filaments.
SOHO LASCO
The corona is the Sun's outer atmosphere. It begins above the photosphere (the visible "surface" of the Sun) and extends millions of kilometers into space, gradually becoming the solar wind. A Coronal Mass Ejection (CME) is a gigantic eruption of magnetized plasma (electrons and ions, mostly protons) from the solar corona into interplanetary space.
When an Earth-directed CME reaches the Earth, its interaction with the magnetosphere may produce a geomagnetic storm, particularly when the interplanetary magnetic field carried by the CME contains a strong southward component. These disturbances can significantly affect the ionosphere and consequently HF radio propagation.
The following are images of the solar corona obtained by the Large Angle and Spectrometric Coronagraph (LASCO)aboard the Solar and Heliospheric Observatory (SOHO). LASCO uses an occulting disk to block the intense light from the solar disk, allowing the much fainter surrounding corona to be observed. Its coronagraphs provide wide-field observations of the corona and are particularly useful for detecting and tracking coronal mass ejections (CMEs) as they propagate away from the Sun. The C2 coronagraph observes the inner corona from approximately 1.5 to 6 solar radii, while C3 extends the field of view from approximately 3.7 to 30 solar radii. Click on each image to see the high-resolution version. Source: SOHO/NASA-ESA.
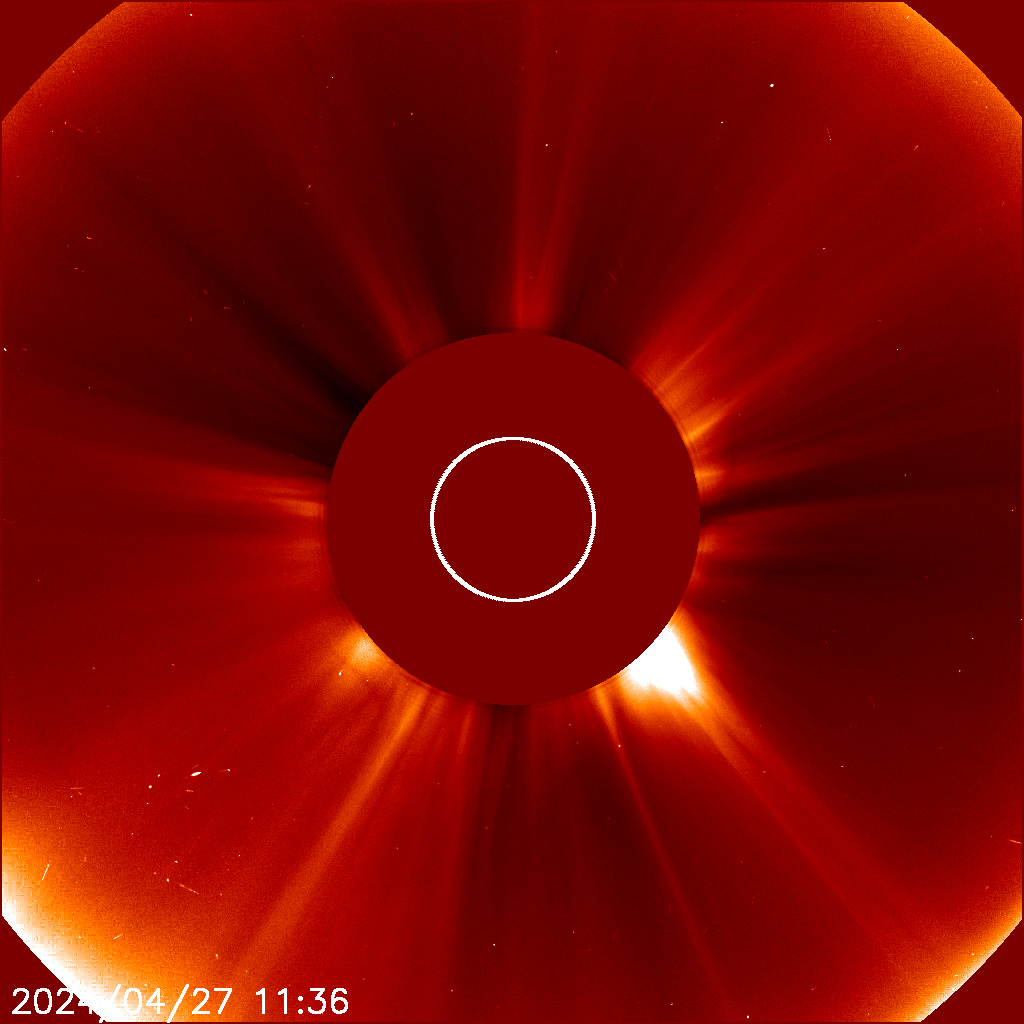
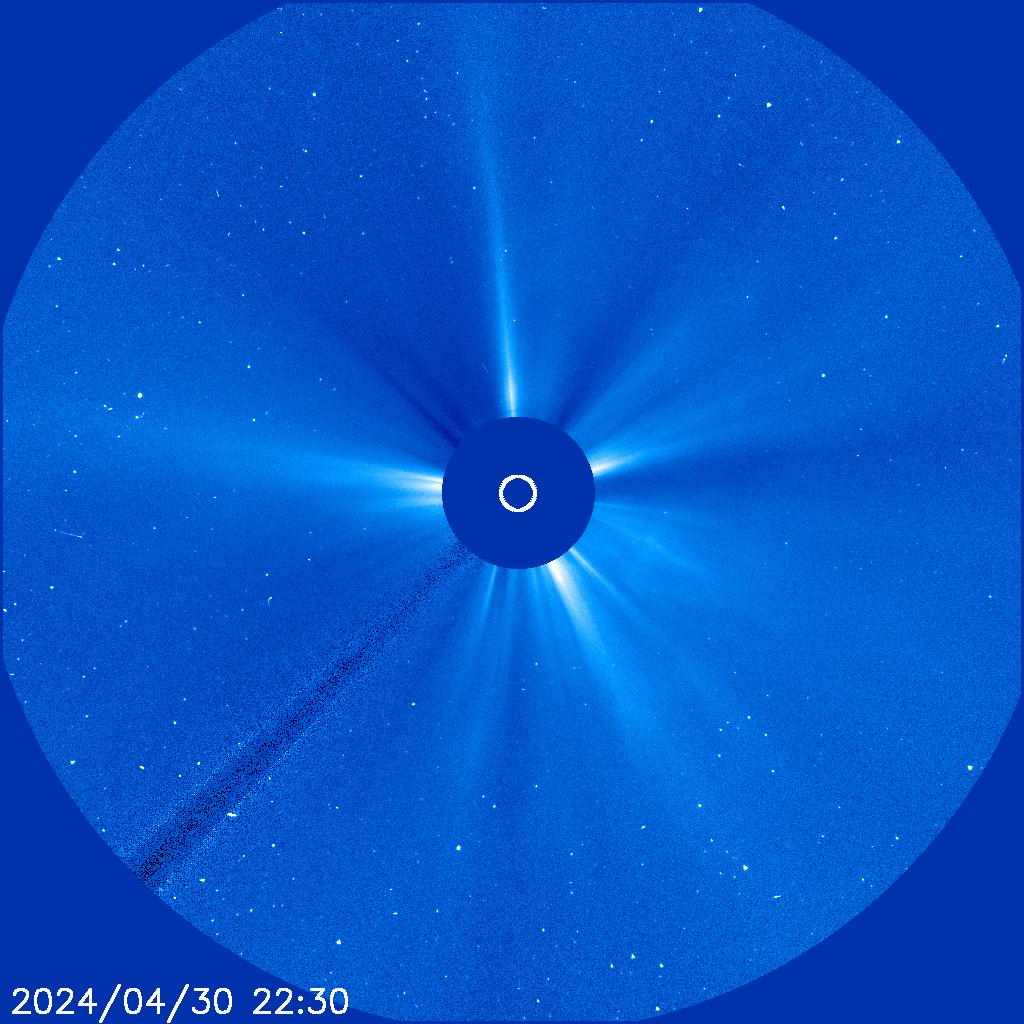
Current images of the solar corona acquired with the LASCO (Large Angle and Spectrometric Coronagraph) instrument. The C2 image displays the inner solar corona (up to 8.4 million km from the Sun), while the C3 image displays the outer solar corona (up to 45 million km from the Sun).
MLSO
Coronameter image from the Mauna Loa Solar Observatory (Hawaii).

The K-Cor coronagraph at the Mauna Loa Solar Observatory (MLSO) observes the inner solar corona in visible light by blocking the bright solar disk and measuring polarized light scattered by free electrons in the corona. Its observations are particularly useful for detecting the formation and early evolution of coronal mass ejections (CMEs) close to the Sun.
Solar Flux Index
There are several ways to monitor solar activity over time. Some indicators are particularly useful for assessing its impact on HF radio propagation, including the Solar Flux Index (SFI) and the Sunspot Number (SSN).
The Solar Flux Index (SFI or F10.7) is a measure of the solar radio flux per unit frequency at a wavelength of 10.7 cm (2800 MHz). Emission from the Sun at centimetric (radio) wavelength is due primarily to coronal plasma trapped in the magnetic fields overlying active regions. There is a direct relationship between the solar activity level and this emission. Elevated Solar Flux Index (SFI) values are often associated with improved propagation conditions and increased openings in the upper HF bands.
The SFI is measured daily in Canada at the
The plots, provided by Paul L Herrman (N0NBH), show the trend of the following parameters during the last month:
- Green plot: relative intensity of the solar extreme-ultraviolet (EUV) irradiance measured by the Extreme Ultraviolet Variability Experiment (EVE) aboard NASA's Solar Dynamics Observatory (SDO). EVE measures full-disk solar EUV spectral irradiance over a broad range of wavelengths.
- Blue plot: relative intensity of the solar extreme-ultraviolet (EUV) irradiance measured by the Solar EUV Monitor (SEM) of the CELIAS instrument aboard the Solar and Heliospheric Observatory (SOHO). CELIAS/SEM monitors full-disk solar irradiance in an 8 nm band centered at 30.4 nm and in a broader 0.1–50 nm soft-X-ray/EUV channel.
- Red plot: SFI measured by the Dominion Radio Astrophysical Observatory (Canada).
- Yellow plot: sunspot number (SN) measured by the Boulder Observatory (NOAA), Wolf number.
Sunspots
Another widely used indicator of solar activity is the Sunspot Number (SSN), which can be calculated using different counting methods and data series. Sunspots are relatively cool, magnetically active regions of the solar photosphere that appear darker than their surroundings. A larger number of sunspots generally indicates a higher level of solar magnetic activity and tends to be associated with increased solar extreme-ultraviolet (EUV) output. The resulting increase in ionization in the upper ionosphere can raise the Maximum Usable Frequency (MUF) for specific radio paths. The Sunspot Number and the Solar Flux Index (SFI) are therefore strongly correlated indicators of the solar activity level.
The Mount Wilson Observatory in California provides the following sunspot classification:
| Type | Description |
|---|---|
| Alpha | A unipolar sunspot group |
| Beta | A sunspot group having both positive and negative magnetic polarities (bipolar), with a simple and distinct division between the polarities |
| Gamma | A complex active region in which the positive and negative polarities are so irregularly distributed as to prevent classification as a bipolar group |
| Beta-Gamma | A sunspot group that is bipolar but which is sufficiently complex that no single, continuous line can be drawn between spots of opposite polarities |
| Delta | A qualifier to magnetic classes indicating that umbrae separated by less than 2 degrees within one penumbra have opposite polarity |
| Beta-Delta | A sunspot group of general beta magnetic classification but containing one (or more) delta spot(s) |
| Beta-Gamma-Delta | A sunspot group of beta-gamma magnetic classification but containing one (or more) delta spot(s) |
| Gamma-Delta | A sunspot group of gamma magnetic classification but containing one (or more) delta spot(s) |
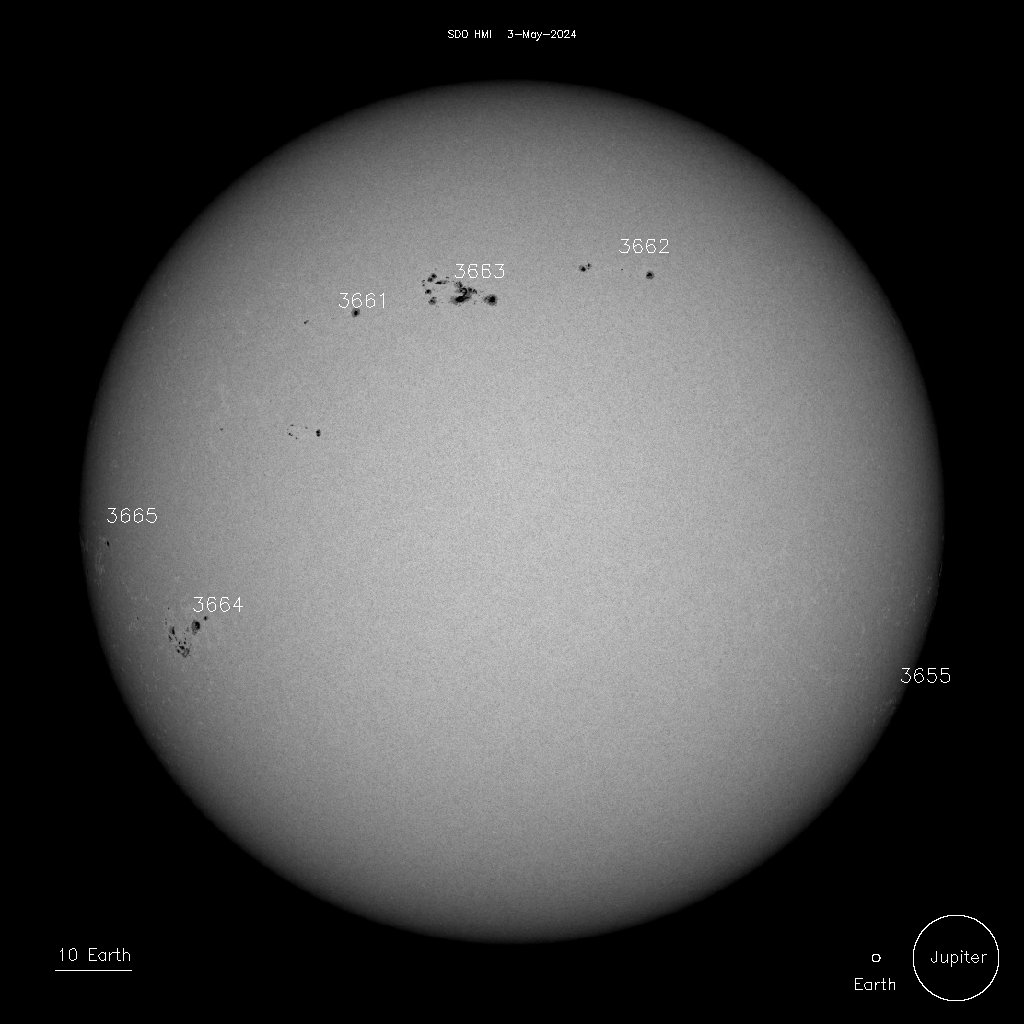
The image shows the solar photosphere, where current sunspots and sunspot groups can be identified. Near solar minimum, the number of visible sunspots may become very low and there can be periods with no sunspots at all. Most sunspot groups are bipolar, containing magnetic regions of opposite polarity. According to Hale's polarity law, the leading polarity of bipolar active regions is generally the same within a given solar hemisphere during one solar cycle and opposite in the other hemisphere. This polarity pattern reverses from one approximately 11-year sunspot cycle to the next. The Sun's global magnetic field also reverses polarity around the time of solar maximum, completing a full magnetic cycle in approximately 22 years.
HF propagation forecast applications, such as VOACAP and others, usually take the Sunspot Number (SSN) as an input parameter to perform the calculations. Due to the fact that there are several different methods of determining the SSN, it is paramount to check first which format actually uses your forecasting application. A link to the NOAA's National Geophysical Data Center (NGDC) pages follows, where you can get current data about the Sunspot Number in different formats, including ISN (International Sunspot Number, compiled by the Sunspot Index Data Center in Belgium), American Relative Sunspot Numbers, ancient sunspot data and Group Sunspot Numbers.

Remark for VOACAP users: please use the following values, corresponding to the Smoothed International Sunspot Number (courtesy SIDC, Royal Observatory of Belgium):
2026 04  2026.286 :   90.9     0
2026 05  2026.371 :   87.6     0
2026 06  2026.453 :   84.1     0
2026 07  2026.538 :   79.7   5.6
2026 08  2026.623 :   76.3   6.1
2026 09  2026.705 :   78.0   6.7
2026 10  2026.790 :   75.7   7.5
2026 11  2026.873 :   73.4   8.2
2026 12  2026.958 :   70.8   8.6
2027 01  2027.042 :   68.0   9.0
2027 02  2027.122 :   65.0   9.2
2027 03  2027.204 :   62.5   9.6
2027 04  2027.286 :   60.5   9.9
2027 05  2027.371 :   58.6  10.2
2027 06  2027.453 :   56.9  10.5
2027 07  2027.538 :   55.4  10.7
2027 08  2027.623 :   53.6  10.7
2027 09  2027.705 :   51.4  10.6
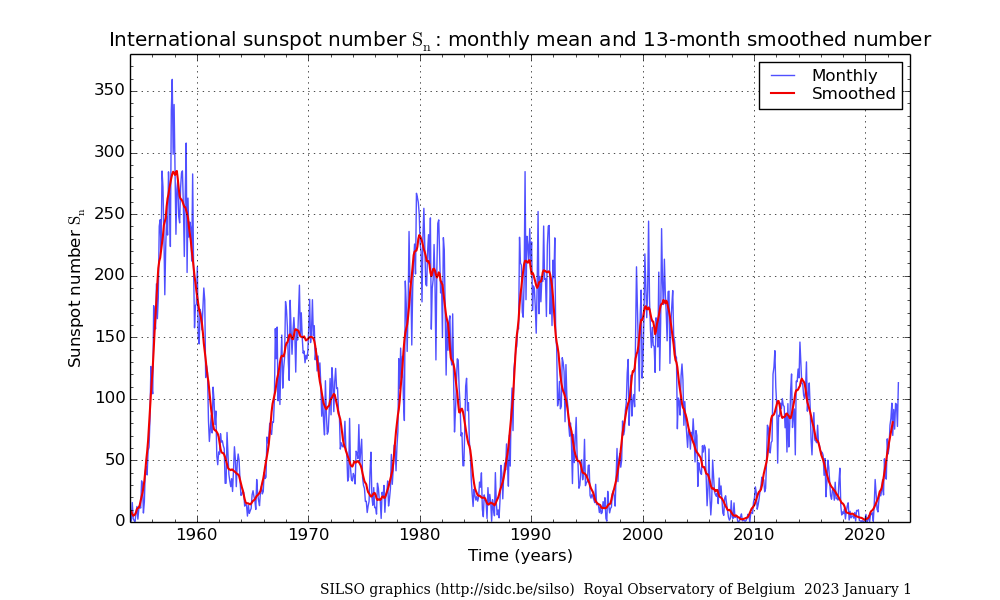
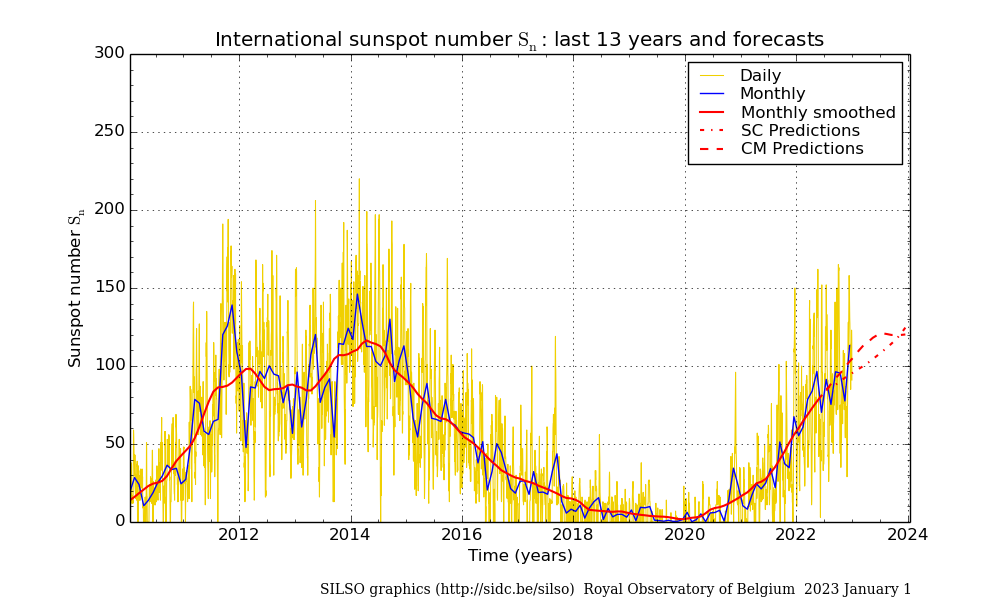
The plots show the sunspot number evolution during the last years. This number follows periodic cycles of an estimated duration of 11 years. At the cycle peaks the sunspot number is higher and the propagation conditions improve. Due to the fact that some sunspots may appear grouped, the "Wolf number" is used in the computation, taking into account both the groups and the isolated sunspots. We are currently at solar cycle 25.
HF Radio & Space Weather is a resource dedicated to the operational monitoring of space weather and HF propagation conditions.
This is an educational, non-commercial website. All displayed data is property of their authors and credit and hyperlinks to the corresponding sources are provided. If you want to contact the webmaster, please use this form.